Download
1 / 50
510 likes | 652 Views
Perfectly Competitive Supply: The Cost Side of The Market. Thinking About Supply: The Importance of Opportunity Cost. Example How much time should Harry spend recycling soft drink containers?. Thinking About Supply: The Importance of Opportunity Cost.

E N D
Thinking About Supply: The Importance of Opportunity Cost • Example • How much time should Harry spend recycling soft drink containers? Chapter 6: Perfectly Competitive Supply
Thinking About Supply: The Importance of Opportunity Cost • Harry is choosing between washing dishes for $6/hour and collecting containers at 2 cents each. • Opportunity cost of collecting cans is $6/hour. Chapter 6: Perfectly Competitive Supply
Example Search time (hours/day) Total number of containers found Additional number of containers found 0 0 1 600 2 1,000 3 1,300 4 1,500 5 1,600 600 400 300 200 100 Chapter 6: Perfectly Competitive Supply
Thinking About Supply: The Importance of Opportunity Cost • Costs and Benefits • 1 hour collecting cans = (600)(.02) = $12 • Benefit ($12) > Opportunity Cost ($6) • 2nd hour benefit ($8) > Opportunity Cost ($6) • 3rd hour benefit ($6) = Opportunity Cost ($6) Chapter 6: Perfectly Competitive Supply
Thinking About Supply: The Importance of Opportunity Cost • Question • What is the lowest redemption price that would induce Harry to recycle 1 hour/day? • Solution • 600 containers x 1 cent = $6 = opportunity cost of washing dishes Chapter 6: Perfectly Competitive Supply
Thinking About Supply: The Importance of Opportunity Cost • Reservation Price Chapter 6: Perfectly Competitive Supply
Thinking About Supply: The Importance of Opportunity Cost • Reservation Price • 1 hour recycling = p(600) = $6 = 1 cent • 2 hours recycling = p(400) = $6 = 1.5 cents • 3 hours recycling = p(300) = $6 = 2 cents • 4 hours recycling = p(200) = $6 = 3 cents • 5 hours recycling = p(100) = $6 = 6 cents Chapter 6: Perfectly Competitive Supply
6 3 2 1.5 1 6 10 13 16 15 An Individual Supply Curve for Recycling Services Harry’s Supply Curve Deposit (cents/can) 0 Recycled cans (100s of cans/day) Chapter 6: Perfectly Competitive Supply
Harry’s Supply Curve Barry’s Supply Curve 6 6 3 3 2 2 1.5 1.5 1 1 0 0 6 10 13 16 6 10 13 16 15 15 The Market Supply Curvefor Recycling Services Deposit (cents/can) + Deposit (cents/can) + Recycled cans (100s of cans/day) Recycled cans (100s of cans/day) Chapter 6: Perfectly Competitive Supply
6 3 2 1.5 1 0 12 20 26 32 30 The Market Supply Curvefor Recycling Services Market Supply Curve Deposit (cents/can) = = Recycled cans (100s of cans/day) Chapter 6: Perfectly Competitive Supply
6 3 2 1.5 1 0 6 10 13 16 15 The Market Supply Curve with 1,000 Identical Sellers Market Supply Curve Deposit (cents/can) Recycled cans (100,000s of cans/day) Chapter 6: Perfectly Competitive Supply
Thinking About Supply: The Importance of Opportunity Cost • What do you think? • Why is the supply curve upward sloping? Chapter 6: Perfectly Competitive Supply
Profit-Maximizing Firms in Perfectly Competitive Markets • Profit Maximization • Profit • Total Revenue - All Costs (explicit & implicit) • Profit-Maximizing Firms • Goal of the firm is to maximize the difference between total revenues and total costs Chapter 6: Perfectly Competitive Supply
Profit-Maximizing Firms in Perfectly Competitive Markets • The Perfectly Competitive Market • A market in which no individual supplier has significant influence on the market price of the product • A Price Taker • A firm that has no influence over the price at which it sells its product Chapter 6: Perfectly Competitive Supply
Profit-Maximizing Firms in Perfectly Competitive Markets • The Characteristics of Perfect Competition • All firms sell the same standardized product. • The market has many buyers and sellers, each of which buys or sells only a small fraction of the total quantity exchanged. Chapter 6: Perfectly Competitive Supply
Profit-Maximizing Firms in Perfectly Competitive Markets • The Characteristics of Perfect Competition • Productive resources are mobile • Buyers and sellers are well informed. Chapter 6: Perfectly Competitive Supply
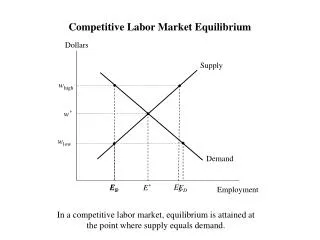
S P0 D Q0 The Demand Curve Facing a Perfectly Competitive Firm Market supply and demand Price ($/unit) Market Quantity (units/month) Chapter 6: Perfectly Competitive Supply
P0 Di The Demand Curve Facing a Perfectly Competitive Firm Individual firm demand Price ($/unit) Individual Firm’s Quantity (units/month) Chapter 6: Perfectly Competitive Supply
Profit-Maximizing Firms in Perfectly Competitive Markets • Concepts of Production • Factor of production • An input used in the production of a good or service • Short run • A period of time sufficiently short that at least some of the firm’s factors of production are fixed Chapter 6: Perfectly Competitive Supply
Profit-Maximizing Firms in Perfectly Competitive Markets • Concepts of Production • Fixed factor of production • An input whose quantity cannot be altered in the short run • Variable factor of production • An input whose quantity can be altered in the short run Chapter 6: Perfectly Competitive Supply
Profit-Maximizing Firms in Perfectly Competitive Markets • Assume • A company makes glass bottles • Two factors of production • Labor (variable) • Capital (fixed) • A bottle-making machine Chapter 6: Perfectly Competitive Supply
Employment and Output for a Glass Bottle Maker Total number of employees per day Total number of bottles per day 0 0 1 80 2 200 3 260 4 300 5 330 6 350 7 362 Observation Output gains from each additional worker begins to diminish with the third employee Chapter 6: Perfectly Competitive Supply
Profit-Maximizing Firms in Perfectly Competitive Markets • Law of Diminishing Returns • A property of the relationship between the amount of a good or service produced and the amount of a variable factor required to produce it • It says that when some factors of production are fixed, increased production of the good eventually requires ever-larger increases in the variable factor Chapter 6: Perfectly Competitive Supply
Profit-Maximizing Firms in Perfectly Competitive Markets • Some Important Cost Concepts • Assume • The cost of the bottle making machine is $40/day and it is a fixed cost. • Fixed cost • The sum of all payments made to a firm’s fixed factors of production Chapter 6: Perfectly Competitive Supply
Profit-Maximizing Firms in Perfectly Competitive Markets • Some Important Cost Concepts • Assume • The cost of labor is $12/worker and is a variable cost. • Variable cost • The sum of all payments made to the firms variable factors of production Chapter 6: Perfectly Competitive Supply
Employees per day Bottles per day Fixed cost ($/day) Variable cost ($/day) Total cost ($/day) Marginal cost ($/bottle) Fixed, Variable, and Total Costs of Bottle Production 0 0 40 0 40 1 80 40 12 52 2 200 40 24 64 3 260 40 36 76 4 300 40 48 88 5 330 40 60 100 6 350 40 72 112 7 362 40 84 124 0.15 0.10 0.20 0.30 0.40 0.60 1.00 Chapter 6: Perfectly Competitive Supply
Profit-Maximizing Firms in Perfectly Competitive Markets • Some Important Cost Concepts • Total Cost • Fixed Cost + Variable Cost • Marginal Cost • Measures how total cost changes with a change in output Chapter 6: Perfectly Competitive Supply
Employees per day Output (bottles/day) Total revenue ($/day) Total cost ($/day) Profit ($/day) MB = .35 MC = .15 MB = .35 MC = .10 MB = .35 MC = .20 MB = .35 MC = .30 MB = .35 MC = .40 MB = .35 MC = .60 MB = .35 MC = 1.00 Output, Revenue, Costs, and Profit 0 0 0 40 -40 1 80 28 52 -24 2 200 70 64 6 3 260 91 76 15 4 300 105 88 17 5 330 115.50 100 15.50 6 350 122.50 112 10.50 7 362 126.70 124 2.70 What will happen to the profit maximizing output if: (a) employees receive a wage of $6/day; (b) fixed costs are $45? Chapter 6: Perfectly Competitive Supply
Profit-Maximizing Firms in Perfectly Competitive Markets • A Note on the Firm’s Shutdown Condition • When producing at a loss, a firm must cover its variable cost to minimize losses. • Short-run shutdown condition Chapter 6: Perfectly Competitive Supply
Profit-Maximizing Firms in Perfectly Competitive Markets • Average Variable Cost and Average Total Cost • Average Variable Cost • Variable cost divided by total output Chapter 6: Perfectly Competitive Supply
Profit-Maximizing Firms in Perfectly Competitive Markets • Average Variable Cost and Average Total Cost • Short-run shutdown condition Chapter 6: Perfectly Competitive Supply
Profit-Maximizing Firms in Perfectly Competitive Markets • Average Variable Cost and Average Total Cost • Average Total Cost • Total cost divided by total output Chapter 6: Perfectly Competitive Supply
Profit-Maximizing Firms in Perfectly Competitive Markets • Average Variable Cost and Average Total Cost • Profits = TR – TC or (P x Q) - (ATC x Q) • To be profitable: P > ATC Chapter 6: Perfectly Competitive Supply
Average Variable Cost and Average Total Cost of Bottle Production Average total cost ($/unit of output) Average variable cost ($/unit of output) Variable cost ($/day) Total cost ($/day) Marginal cost ($/bottle) Employees per day Bottles per day 0 0 0 40 1 80 12 0.150 52 0.650 2 200 24 0.120 64 0.320 3 260 36 0.138 76 0.292 4 300 48 0.160 88 0.293 5 330 60 0.182 100 0.303 6 350 72 0.206 112 0.320 7 362 84 0.232 124 0.343 0.15 0.10 0.20 0.30 0.40 0.60 1.00 Chapter 6: Perfectly Competitive Supply
Upward-sloping MC corresponds to diminishing returns MC ATC AVC 80 200 260 300 362 MC = AVC & ATC at their minimum points 330 350 The Marginal, Average Variable, and Average Total Cost Curves for a Bottle Manufacturer 0.65 0.60 0.55 0.50 0.45 0.40 Cost ($/bottle) 0.35 0.30 0.25 0.20 0.15 0.10 0.05 Output (bottles/day) Chapter 6: Perfectly Competitive Supply
MC 0.35 ATC 0.33 AVC 0.30 Profit maximizing output: P = MC 0.25 Price 0.20 0.15 0.12 0.10 0.07 160 200 260 300 • Less than 260 bottles/day P > MC and output should be increased • More than 260 bottles/day P < MC and output should be decreased Price = Marginal Cost: The Perfectly Competitive Firm’s Profit-Maximizing Supply Rule Cost ($/bottle) Output (bottles/day) Chapter 6: Perfectly Competitive Supply
MC • Price = MC at 260 bottles/day • ATC = .12/bottle • TR = (.20)(260) = $52/day • TC = (.12)(26) = $31.20/day • Profit = $52 - $31.20 = $20.80/day ATC AVC Price 0.20 0.12 260 Price = Marginal Cost: The Perfectly Competitive Firm’s Profit-Maximizing Supply Rule Cost ($/bottle) Output (bottles/day) Chapter 6: Perfectly Competitive Supply
MC • Price = .08/bottle • P = MC at 180 bottles/day • ATC = .10/bottle • P < ATC by .02/bottle • Profit = -.02 x 180 = -3.60//day ATC AVC 0.10 Price 0.08 180 A Negative Profit Cost ($/bottle) Output (bottles/day) Chapter 6: Perfectly Competitive Supply
Profit-Maximizing Firms in Perfectly Competitive Markets • The Law of Supply • The perfectly competitive firm’s supply curve is its marginal cost curve • Every quantity of output along the market supply represents the summation of all the quantities individual sellers offer at the corresponding price Chapter 6: Perfectly Competitive Supply
Profit-Maximizing Firms in Perfectly Competitive Markets • The Law of Supply • At every point along the market supply curve, price measures what it would cost producers to expand production by one unit. • Recall • Demand measures the benefit side of the market • Supply measures the cost side of the market Chapter 6: Perfectly Competitive Supply
Determinants of Supply Revisited • Determinants of Supply • Technology • Input prices • Number of suppliers • Expectations • Changes in prices of other products Chapter 6: Perfectly Competitive Supply
Applying the Theory of Supply • Economic Naturalist • When recycling is left to private market forces, why are many more aluminum beverage containers recycled than glass ones? Chapter 6: Perfectly Competitive Supply
Applying the Theory of Supply • Example • What is the socially optimal amount of recycling of glass containers? Chapter 6: Perfectly Competitive Supply
Market supply curve of glass container recycling services • 60,000 citizens would • pay 6 cents for each • container which • equals marginal • benefit 6 3 2 1.5 1 • The local government pays 6 cents/container • The optimal quantity of containers is 16,000/day where MC(.06) = marginal benefit 6 10 13 15 16 The Supply Curve of Container Recycling Services for Burlington, Vermont Redemptions price (cents/container) Number of containers recycled (1,000s of containers/day) Chapter 6: Perfectly Competitive Supply
Applying the Theory of Supply • What do you think? • Will all containers be removed from the environment at $0.06/container? • Why is the optimal amount of removal 16,000/day? • Will private individuals choose to remove 16,000 containers/day? Chapter 6: Perfectly Competitive Supply
Supply and Producer Surplus • Producer Surplus • The amount by which price exceeds the seller’s reservation price Chapter 6: Perfectly Competitive Supply
Equilibrium P = $2 & Q = 4,000 S D The Supply and Demand in the Market for Milk • Producer surplus is the difference between $2 and the reservation price at each quantity • Producer surplus = (1/2)(4,000 gallons/day)($2/gallon) = $4,000/day 3.00 2.50 Price ($/gallon) 2.00 1.50 1.00 .50 0 1 2 3 4 5 6 7 8 9 10 11 12 Quantity (1,000s of gallons/day) Chapter 6: Perfectly Competitive Supply
S 3.00 2.50 Price ($/gallon) 2.00 Producer surplus = $4,000/day 1.50 1.00 D .50 0 1 2 3 4 5 6 7 8 9 10 11 12 Quantity (1,000s of gallons/day) Producer Surplus in the Market for Milk Chapter 6: Perfectly Competitive Supply
End of Chapter