Download
1 / 23
1.8k likes | 3.2k Views
Basic Problem Solving Tools. Mark Pitman. Contents. Topics/issues to be covered include: Brainstorming Cause and Effect diagrams Pareto Charts. 2. Objective of the training. to ensure a full understanding of the problem solving tools: what they do where to use them how to use them.

E N D
Basic Problem Solving Tools Mark Pitman
Contents Topics/issues to be covered include: • Brainstorming • Cause and Effect diagrams • Pareto Charts 2
Objective of the training to ensure a full understanding of the problem solving tools: • what they do • where to use them • how to use them 3
The “Bigger Picture” – the problem solving process brainstorming problem identification Pareto diagrams cause & effect problem prevention problem selection Problem/Issue problem analysis solution implementation cause & effect Pareto diagrams solution evaluation brainstorming 4
Brainstorming – why use it? • to establish a common method for a team to creatively and efficiently generate a high volume of ideas on any topic • by creating a process that is free of criticism and judgement. CREATING BIGGER & BETTER IDEAS 5
Brainstorming - what does it do? • encourages open thinking • gets all team members involved and enthusiastic • allows members to build on each others creativity • focused on one mission • high volume of creative ideas • encourages team work • encourages actions and commitment 6
Brainstorming - the steps involved structured brainstorming question stated and agreed upon go around the room, each member in turn gives an idea write ideas on flipchart / writing surface pass as ideas are exhausted review ideas list for clarity and discard any duplicates 7
Brainstormingrules everybody understands the question, issue or problem let the mind freewheel state that there are no right and wrong answers challenge all practices there may be many solutions any member can pass at any time (structured) encourage participation of all members ideas are recorded with the same words of the speaker keep the process moving and relatively short (5 - 20 mins) preserve subtle differences of ideas 8
brain storming - obstacles to creative thinking • thinking there is only one correct answer • fear of being wrong • fear of looking foolish • strong personalities dominating the session • failing to challenge the obvious • defining the problem correctly • not getting everybody involved - spark of ideas missing 9
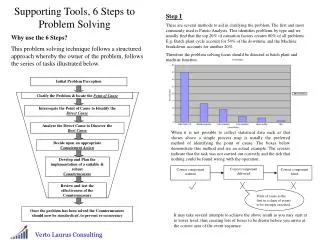
Cause & Effect - find and cure causes NOT symptoms Why use a “fishbone diagram”? To allow a team to identify, explore and display, in increasing detail, all of the possible causes related to a problem or condition to discover its root cause(s) 10
Cause & Effect - what does it do ? shows the relationship between the effect and all possible causes categorises the cause of every problem / effect encourages a team to focus on the content of the problem creates a snapshot of collective knowledge and consensus of a team around a problem focuses the team on causes, not symptoms encourages team work encourages actions and commitment team members involved and enthusiastic 11
Cause & Effect – the major cause categories “4M” Manpower Machinery Materials Methods “4P” Personnel Plant Policies Procedures OR OR 12
Cause & Effect – using the cause categories • be flexible • production process machines (equipment) methods (how work is done) materials (components or raw materials) manpower (the human element) • service process policies (higher - level decision rules) procedures (steps in a task) plant (equipment and space) people (the human element) • both types environment (buildings, logistics and space) measurement (calibration and data collection) are frequently used • there is no perfect set or number of categories. make them fit the problem 13
Cause & Effect - the steps involved agree on one simple statement that describes the selected problem place the problem statement in the head on the right hand side of the writing surface draw major cause category bones to the backbone of the fishbone diagram add cause riblets to the major cause category bones add further riblets to show relationships between causes 14
Cause & Effect exercise Cat. 1 Cat. 2 Effect Cat. 3 Cat. 4 take 15 mins to construct a detailed fishbone / cause and effect diagram using the categories you have just agreed. 15
Cause & Effect exercise methods machinery no record tyre pressure fuel mix too rich use wrong gears always late under-inflated tyres poor hearing mech. doesn’t have specs drive too fast radio too loud poor design carburettor adjustment poor petrol mileage difficult air valve stems can’t hear engine impatience no oil change wrong petrol type poor training poor maintenance £ no owner’s manual £ “when in rome” improper lubrication don’t know recommended petrol type no awareness don’t know right oil wrong oil poor driving habits no owner’s manual manpower materials 16
Pareto chart – focus on the key problems Why use a Pareto? to focus efforts on the problems that offer the greatest potential for improvement by showing their relative frequency or size in a descending bar graph 17
Pareto chart - what does it do? • focuses team on causes that will have greatest impact if solved • based on proven Pareto principle: 20% of the sources cause 80% of any problem • displays relative importance of problems in simple, quickly interpreted, visual format • progress is highly visible, provides incentive to push for further improvement • helps prevent “shifting the problem” where the “solution” removes some causes but worsens others 18
Pareto chart - what does it do? # £ time P A R E T O cause / category 19
Pareto chart - how to construct • decide on the problem you want to know more about • choose the causes of the problem • brainstorming • existing data • choose the most meaningful unit of measure • frequency • cost • hours • choose the time period of the study • design the check sheet • gather the necessary data using the check sheet • real time • historical 20
Pareto chart - rules • be prepared to use different units of measurement • data is collected over a sufficient period to be sure the data represent “typical” results during a “typical” cycle of the business • agree all definitions used - causes • check sheets are easiest method for collecting data • include source, location and time period covered 21
Summary – the problem solving process brainstorming problem identification pareto diagrams cause & effect problem prevention problem selection Problem/Issue problem analysis solution implementation cause & effect pareto diagrams solution evaluation brainstorming 22
Finally! Thank you for your time. Do you have any questions? 23