Download
1 / 16
160 likes | 266 Views
Patterns and trends in child obesity. A presentation of the latest data on child obesity. Prevalence of overweight among children National Child Measurement Programme 2011/12. One in five children in Reception is overweight or obese (boys 23.5%, girls 21.6%).

E N D
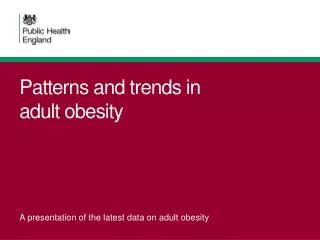
Patterns and trends inchild obesity A presentation of the latest data on child obesity
Prevalence of overweight among childrenNational Child Measurement Programme 2011/12 One in five children in Reception is overweight or obese (boys 23.5%, girls 21.6%) One in three children in Year 6 is overweight or obese (boys 35.4%, girls 32.4%) Child overweight (including obesity)/ excess weight: BMI ≥ 85th centile of the UK90 growth reference Patterns and trends in child obesity
Prevalence of obesity by ageHealth Survey for England 1995-2011 (3-year average) Child obesity: BMI ≥ 95th centile of the UK90 growth reference Patterns and trends in child obesity
Prevalence of overweight by ageHealth Survey for England 1995-2011 (3-year average) Child obesity: BMI ≥ 85thcentile of the UK90 growth reference Patterns and trends in child obesity
Prevalence of obesity by school year and sexNational Child Measurement Programme 2006/07 to 2011/12 Child obesity: BMI ≥ 95th centile of the UK90 growth reference. 95% confidence intervals are displayed on the chart Patterns and trends in child obesity
Prevalence of overweight by school year and sexNational Child Measurement Programme 2006/07 to 2011/12 Child obesity: BMI ≥ 95th centile of the UK90 growth reference. 95% confidence intervals are displayed on the chart Patterns and trends in child obesity
Prevalence by BMI statusNational Child Measurement Programme 2011/12 This analysis uses the 2nd, 85th and 95th centiles of the British 1990 growth reference (UK90) for BMI to classify children as underweight, healthy weight, overweight and obese. These thresholds are the most frequently used for population monitoring within England. Patterns and trends in child obesity
BMI distribution: Reception childrenNational Child Measurement Programme 2011/12 Patterns and trends in child obesity
BMI distribution: Year 6 childrenNational Child Measurement Programme 2011/12 Patterns and trends in child obesity
Local authorities in England Obesity prevalence and deprivationNational Child Measurement Programme 2011/12 – Year 6 children Child obesity: BMI ≥ 95th centile of the UK90 growth reference Patterns and trends in child obesity
Obesity prevalence by deprivation decileNational Child Measurement Programme 2011/12 Child obesity: BMI ≥ 95th centile of the UK90 growth reference Patterns and trends in child obesity
Children in Reception (aged 4-5 years) Obesity prevalence by deprivation decileNational Child Measurement Programme 2011/12 Child obesity: BMI ≥ 95th centile of the UK90 growth reference Patterns and trends in child obesity
Children in Year 6 (aged 10-11 years) Obesity prevalence by deprivation decileNational Child Measurement Programme 2011/12 Child obesity: BMI ≥ 95th centile of the UK90 growth reference Patterns and trends in child obesity
Children in Reception (aged 4-5 years) Obesity prevalence by ethnic groupNational Child Measurement Programme 2011/12 Child obesity: BMI ≥ 95th centile of the UK90 growth reference Patterns and trends in child obesity
Children in Year 6 (aged 10-11 years) Obesity prevalence by ethnic groupNational Child Measurement Programme 2011/12 Child obesity: BMI ≥ 95th centile of the UK90 growth reference Patterns and trends in child obesity
For more information: www.noo.org.uk info@noo.org.uk Patterns and trends in child obesity