Download
1 / 29
290 likes | 368 Views
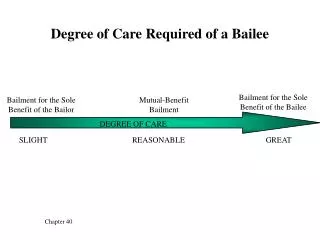
Technology and automation in workplaces: who needs to know what, and how? Professor Richard Noss Institute of Education, University of London. along a dimension of required mathematics. Studies of mathematics in workplaces. 2 starting points from preceding studies.

E N D
Technology and automation in workplaces: who needs to know what, and how?Professor Richard NossInstitute of Education, University of London
Techno-mathematical Literacies at Work 2003-7 • Aims • characterise the mathematical needs of employees in ICT-rich workplaces • develop appropriate mathematical understandings through iterative (co-)design of learning opportunities Funded by the Economic and Social Research Council, UK 2003-7
Techno-mathematical Literacies(TmL) TmL are new skills needed to be functional in IT-rich workplaces that are striving for improvements in efficiency and customer communication why literacies? why techno-mathematical?
Project methodology: two phases • Each phase opened windows on how different communities made sense of critical elements of computer inputs & outputs & symbolic artefacts
Boundary objects & boundary crossing Boundary objects are artefacts that • stand at interface between communities of practice • satisfy the informational requirements of each • where meanings are sources of debate so boundary crossing may not occur • Symbolic artefacts as (potential) boundary objects
1: Financial Service Sector case study • highly competitive market • increasingly customer focused • increasing complexity of products • heavily dependent on computer systems • invisibility of the model
TmL research in financial services 2 large pension/investment companies 1 specialist mortgage provider: “current account mortgage” (CAM)
Boundaries between different communities in finance industry sales Actuaries call centre staff Researchers IFAs customers
TmL in financial services • understanding key variables (e.g. interest rates, admin fees) • modelling these as relationships • interpreting graphs (estimates and predictions)
Pseudo-mathematical labels Numbers as labels (“number 27 bus”): Credit card: “1.8% per month” Mortgage: “5.9% per annum APR” Graphs as qualitative “diagrams” rather than measured images of relationships
technologically-enhanced boundary object
TEBOs in pensions modelling pension statement with spreadsheet • management charges • market value reduction compound interest tool explore “present value” of money with spreadsheet and interactive tool
2. Car Manufacturing case study observations of • practice & training in 2 large car factories • “green belt” SPC training
Boundaries between different communities in car factories managers SPC department researchers team leaders operators
symbolic artefact on shopfloor control vs specification running out of time
Information in corner X-bar: mean R-bar: mean range Control limits Cp = 1.96 Cpk = 1.50 Hartley’s constants for SD estimation
process capability indices • one-number measures of how well the process is performing: your Cpk = 1.4 • calculated from data, not from management • employees can be ‘beaten up’ for low Cpks • most difficult part of training
control charts & one measure values Cp & Cpk were pseudo-mathematical TML needed understanding & reducing variation including • knowing the difference between common and special cause variation, and how to respond • noticing trends & patterns in processes graphing & interpreting time series data (control charts) including distinguishing • mean versus target • specification versus control limits
technologically-enhanced boundary object ‘Irrelevant’ half of the Cpk equation is greyed-out. Ratios now represented by moving coloured bars.