Download
1 / 34
340 likes | 354 Views
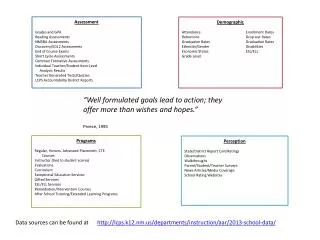
But What Does It All Mean? Key Concepts for Getting the Most Out of Your Assessments. Emily Moiduddin. Why Do We Assess?. Improve children’s learning Meet the needs of children who are struggling Challenge children who are excelling Identify key challenges in our classrooms

E N D
But What Does It All Mean?Key Concepts for Getting the Most Out of Your Assessments Emily Moiduddin
Why Do We Assess? • Improve children’s learning • Meet the needs of children who are struggling • Challenge children who are excelling • Identify key challenges in our classrooms • Figure out what resources we need 2
Objectives • Understand key assessment concepts • Data • Data quality • Mean scores • Distribution of scores • Normal curve • Growth over time • Feel empowered to communicate about your program 4
Additional Resources • Getting Ready to Get the Most out of Your Child Assessments 5
Key Concept 1: Data • Data = Information you collect about children, families, and classrooms • Information on children’s progress for reporting purposes • Ongoing observational assessments • Attendance records • Information about families • Etc. • In other words, any information you can use to improve child learning! 6
Key Concept 2: Data Quality • The birth date problem: • The birth year on record would mean the child is 12 • Parent says birthday is different than what is in your records • Two different birth dates recorded for one child • Quality data avoids the birth date problem. It is: • Correct • Complete • Consistent 7
Data Quality: Validity • Tool has validity when it actually measures the area it is supposed to measure. • Example: Language assessment for a child with high verbal skills • If child is shy, may not respond to unfamiliar assessor/rater • Low scores would reflect social development rather than language • Ask, “Am I measuring what I think I’m measuring?” 8
Data Quality: Reliability • An assessment tool is reliable if it provides consistent, dependable information. • Inter-rater reliability: The assessment leads different assessors/raters to the same conclusion. • Internal consistency: Items in the same tool all measure the same area of learning and development. • Test-retest reliability: If the assessment were repeated in a very short period of time, you would get the same outcome. 9
Data Quality: Using the Right Tools • Assessments should be valid AND reliable. • For assessment systems purchased or that come with a curriculum, publishers usually report validity and reliability in a manual. • For ongoing, observational assessments, ask yourself: • Am I measuring what I want to measure? • Am I measuring it well? • Consult with experts. 10
Tips for Assuring Data Quality • Train (new) teachers in: • Your program’s methods for recording important information (e.g., birth dates) • Recording information in assessments • Interpreting assessment results • When reviewing data, look for odd patterns. • Ask questions such as: • Do I believe the results? • Is there enough information for different teachers to come to the same conclusion? • Select assessments with a record of validity and reliability for children like those in your program (check the manual!). 11
Key Concept 3: Averages • Average = sum of scores divided by the number of scores you have. • Also referred to as the “mean” • Example: Class of 10 children • How many number words from one to ten do they know, on average? 12
Using Average Scores • Compare classrooms, programs or centers • For example, children in Class C may need more support for learning number words than children in A or B 13
Averages at Higher Levels • Examine distributions of scores at the class, program, or center level. 14
Distribution of scores = how spread out around the average a group of scores are. Class A: Children perform at similar levels. Class B: Some children excel and others struggle. Key Concept 4: Distribution of Scores 15
Picturing the Distribution Number of children receiving each score Possible scores on the number-naming task 16
Key Concept 5: The Normal Curve ←Lower Scores Average HigherScores→ 17
The Normal Curve, cont. Standard Deviation: -2 -1 0 1 2 ←Lower Scores Average HigherScores→ 18
Children’s Expected Performance • Norm-referenced, standard scores – Special scoring systems that can be used to compare the performance of children in your classroom to similar groups of children across the United States • Norming sample – A (large) group of children with certain characteristics whose test performance is used to develop special scoring systems • Norms – A summary of the average score and distribution of scores of children in a norming sample • How we expect children with particular characteristics to perform 19
The Normal Curve, Cont. Standard Deviation -1 0 1 68% 16% 16% Scores: 85 100 115
National Comparisons Head Start Average National Average The purple Head Start curve crosses the national average, showing that 25% of Head Start children score above the national average. National Average = 100 points 1 Standard Deviation = 15 points Standardized Scores: 85 to 92 100 Source: FACES 2003 data, ACF 2006 Standard Deviation: -1 to -1/2 0 21
Using Standard Scores • Is my assessment standardized? • Check the manual that came with your materials • The LAP is a standardized tool commonly used in Head Start. • Each standardized assessment sets norms on a different sample of children (i.e., each has its own norming sample with particular characteristics). • Check your manual to make sure you know what comparison you are making and if it is appropriate! 22
Translating Raw Scores into Standard Scores • Raw: The score you calculate based on responses • Standard: The score you pick from a table in the manual. Information you sometimes need includes: • The raw score (always needed) • Child age/birth date • Child gender (especially for social-emotional assessments) • Who reported the information (teacher, parent, direct assessment of child) • Technical assistance providers can provide help in determining standard scores or can train education coordinators to do so.
Key Lessons from the Normal Curve • Through the principles of the normal curve, scores on some assessments can be translated to “standard scores” for comparisons to norms. • In large groups of children, most (68 percent) will score near the average (between 1 standard deviation below and 1 above the average/mean). • On average, children in Head Start score ½ to 1 standard deviation below norms in language, literacy, and mathematics. • Some Head Start children score above the norms. 24
Key Concept 6: Growth Over Time • Where are children’s scores relative to: • Their own scores earlier in the year? • Other children in Head Start or norms at different points in the year? • Do different subgroups show different patterns of growth? • Dual language learners • Children with special education needs • Younger children 25
Identifying Progress Over Time • Depends on the type of assessment used. • Norm-referenced – Compare child’s performance to other children • Due to norming, standard scores only go up if children’s progress exceeds what would be expected from just getting older. • Criterion referenced – Compare children’s performance to pre-defined standard or criteria. • Progress is made as standards are met. 26
Making Other Appropriate Comparisons • A developmental continuum is an outline of: • Expected developmental accomplishments • The age most children should reach them • Example: Literacy - Most children can identify words printed in their environment by the time they are 3-4 years old • Christopher identifies printed words at age 3: In line with expectations for his age • Megan is not noticing printed words at age 4 ½: A potential area for concern 27
Identifying a Developmental Continuum • In your curriculum or with your assessment tool • In a text on child development • See Resources in “Learning From Assessment” toolkit 28
Compare Growth from Fall to Winter, Program 1 Children make large gains from the fall to the winter but still score below the national average in the winter. 30
Compare Growth from Fall to Winter, Program 2 Children make small gains between the fall and winter but score at or above the national average in the winter in all areas. 31
Comparing Gains in Different Programs How would you help think about improving outcomes in each program? 32
Objectives, Revisited • Understand key assessment concepts • Data • Data quality • Mean scores • Distribution of scores • Normal curve • Growth over time • Feel empowered to communicate about your program 33