Download

1 / 48
700 likes | 1.2k Views
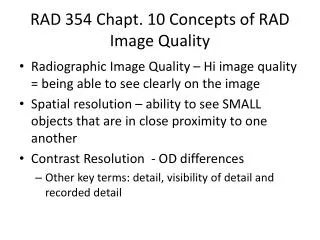
CT. CT Image Quality & Quality Control. Spatial Resolution. Quantifies image blurring “Ability to discriminate objects of varying density a small distance apart against a uniform background” Minimum separation required between two high contrast objects for them to be resolved as two objects.

E N D
CT CT Image Quality & Quality Control
Spatial Resolution • Quantifies image blurring • “Ability to discriminate objects of varying density a small distance apart against a uniform background” • Minimum separation required between two high contrast objects for them to be resolved as two objects
Geometric Factors affectingSpatial Resolution Finite focalspot size focal spot - detector distance focal spot - isocenter distance
Focal Spot Size & Resolution The larger the focal spot the more it will blur a tiny place on the patient.
Detector Size & Resolution The shadow of both objects falls on the same detector. Detector
Focal Spot Size & Resolution Combination of finite focal spot and object position blurs object across multiple detectors. Detectors
Resolvable Object Size &Limiting Resolution • Smallest resolvable high contrast object • Often expressed as line pairs / cm • “Pair” is one object + one space One Pair
Resolvable Object Size:Limiting Resolution • Smallest resolvable high contrast object is half the reciprocal of spatial frequency • Example: • Limited resolution = 15 line pairs per cm • Pair is 1/15th cm • Object is half of pair • 1/15th / 2 • 1/30th cm • .033 cm • 0.33 mm 1/15th cm 1/30th cm
Geometric Factors affectingSpatial Resolution • In-slice • Focal spot size • detector aperture width • Z-axis • slice thickness or collimation • Less variation likely for thinner slices • attenuation variations within a voxel are averaged • partial volume effect
High Contrast (or Limiting) Resolution • Phantom • rows of equally spaced high contrast objects • holes get smaller from row to row • Bars of decreasing size & separation • Determine smallest row of holes where all holes can be clearly seen • smaller holes = better resolution • Visual scoring
Contrast Resolution • Ability of an imaging system to demonstrate small changes in tissue contrast • The difference in contrast necessary to resolve 2 large areas in image as separate structures
CT Contrast Resolution • Significantly better than radiography • CT can demonstrate very small differences in density and atomic # This’ll be on your test. I guarantee it. Contrast Resolution Radiography10% CT<1%
CT Contrast Resolution Depends Upon • Dose • reconstruction algorithm • low spatial frequency algorithm smooths image • Loss of spatial resolution • Reduces noise • enhances perceptibility of low contrast lesions • image display
CT Contrast Resolution Contrast depends on noise Noise depends on # photons detected # photons detected depends on …
# of Photons Detected Depends Upon • photon flux (x-ray technique) • slice thickness • patient size • Detector efficiency • Note: • Good contrast resolution requires that detector sensitivity be capable of discriminating small differences in intensity
Noise Measurement in CT • Scan water phantom • Select regions of interest (ROI) • Take standard deviation in each region • Standard deviation measures noise in ROI
CT Image Quality inEquation Form s2(m) = kT/(td3R) Where s is variance resulting from noise k is a conversion factor (constant) T is transmissivity (inverse of attenuation) t is slice thickness d is pixel size R is dose
Slice Thickness • Thinner slices mean • less active detector area • less photons detected • More noise • To achieve equivalent noise with thinner slices, dose (technique factors) must be increased
Noise Levels in CT: • Increasing slice width = less noiseBUT • Increasing slice width degrades spatial resolution • less uniformity inside a larger pixel • partial volume effect
CT Artifacts:Partial Volume Effect • CT #’s based on linear attenuation coefficient for tissue voxels • If voxel non-uniform (contains several materials), detection process will average
Partial Volume Effect • Can appear as • incorrect densities • streaks • bands • Minimizing • Use thinner slices
Noise Levels in CT: • When dose increases, noise decreases • dose increases # detected photons • Doubling spatial resolution (2X lp/mm) requires an 8X increase in dose for equivalent noise • Smaller voxels mean less radiation per voxel
CT Image Quality Trade-off s2(m) = kT/(td3R) To hold noise constant • If slice thickness goes down by 2 • Dose must go up by 2
Contrast Response FunctionCTF or CRF • Blurring causes loss of contrast • darks get lighter • lights get darker Lower Frequency Higher Frequency Higher Contrast Lower Contrast
CT Spatial vs. Contrast Resolution • Spatial & contrast resolution interact • High contrast objects are easier to resolve • Improve one at the expense of the other • Can only improve both by increasing dose Increasing object size Increasing contrast
Contrast & Detail • Larger objects easy to see even at low contrast Increasing object size Increasing contrast
Contrast & Detail • Small objects only visible at high contrast Increasing object size Increasing contrast
CT Number • Calculated from reconstructed pixel attenuation coefficient (mt - mW) CT # = 1000 X ------------ mW Where: ut = linear attenuation coefficient for tissue in pixel uW = linear attenuation coefficient for water
CT # of Water • What do we check? • Average (ideally 0 by definition) • Standard Deviation (ideally 0) • Flatness • ROI’s at various locations in phantom • Results depend upon protocol • kVp, mA, scan time • slice width • phantom size • ROI position • Problem causes • Mis-calibration • Noise / drift in detector system
Linearity • Relationship of CT #’s to object attenuation coefficients • Checked with phantom of several known materials • average CT # of each material obtained from ROI analysis • Compare CT #’s with known coefficients -100 77 325 -44 50
Preview!CT Artifacts: Causes • motion • metal & high-contrast sharp edges • beam hardening • partial volume averaging • detectors
Image Artifacts:Ring Artifact in 3rd Generation • Causes • 1 or more bad detectors • small offset or gain difference of 1 detector compared to neighbors • detector calibration required • Reason: rays measured by a given detector are all tangent to same circle
Monitor Performance / Hard Copy Output • Standard gray scale image needed • computer generated (SMPTE pattern) • Check monitor & hard copy • 5% patches • Contrast patches • Resolution bars • Hard copy • Measure optical density of steps with densitometer
Table Backlash • Does table return to same position from both directions? • Test • Apply masking tape to table • Load table with weight • Note numerical position • Mark tape at starting position using laser position • Move table away from starting position & then back to same numerical location • Check laser vs. mark on tape
Laser Accuracy • Align phantom on table matching outer laser to external marks on phantom • “Zero” table • Scan phantom • “0” z-location should show correct phantom position on image • Repeat for internal laser
American College of Radiology (ACR) Accreditation Program for CT • CT Accreditation Program involves acquisition of • clinical images • phantom images • dose measurements • submission of scanning protocols. • Providers billing under part B of Medicare Physician Fee Schedule must be accredited to receive technical component reimbursement from Medicare. $$$ $$$
ACR Phantom • Positioning accuracy • CT # accuracy • Image thickness • Low contrast resolution • High contrast (spatial) resolution • CT number uniformity • Image noise
Phantom Section #1 • Alignment • CT # Linearity • Slice Width
ACR Phantom Section #2 • Low Contrast Resolution
ACR Phantom Section #3 • Uniformity & Noise • Distance Accuracy 100 mm
ACR Phantom Secion #4 • High Contrast Resolution
ACR Phantom Criteria • Phantom imaged with clinical protocols • Measurements • CTDTvol • Low contrast performance • Contrast to Noise Ratio