Download
1 / 1
10 likes | 96 Views
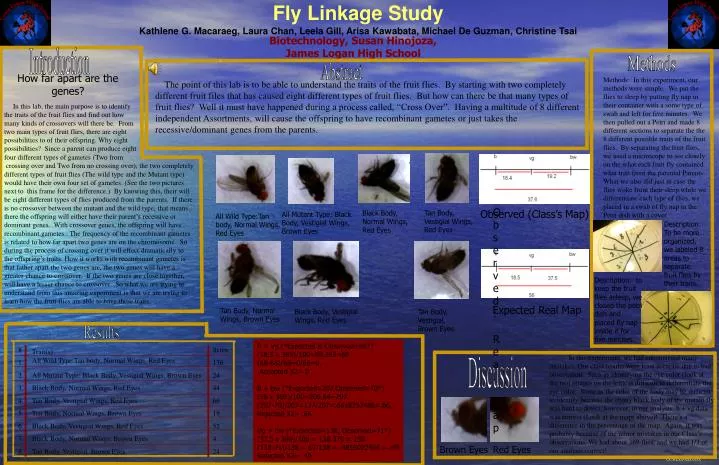
Fly Linkage Study. Kathlene G. Macaraeg, Laura Chan, Leela Gill, Arisa Kawabata, Michael De Guzman, Christine Tsai. Biotechnology, Susan Hinojoza, James Logan High School. Introduction. Methods. Abstract. How far apart are the genes?.

E N D
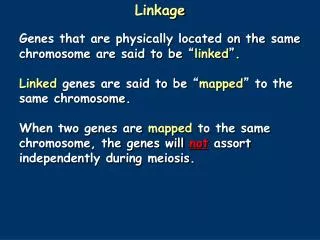
Fly Linkage Study Kathlene G. Macaraeg, Laura Chan, Leela Gill, Arisa Kawabata, Michael De Guzman, Christine Tsai Biotechnology, Susan Hinojoza, James Logan High School Introduction Methods Abstract How far apart are the genes? Methods: In this experiment, our methods were simple. We put the flies to sleep by putting fly nap in their container with a some type of swab and left for five minutes. We then pulled out a Petri and made 8 different sections to separate the the 8 different possible traits of the fruit flies. By separating the fruit flies, we used a microscope to see closely on the what each fruit fly contained what trait from the parental Parents. What we also did just in case the flies woke from their sleep while we differentiate each type of flies, we placed in a swab of fly nap in the Petri dish with a cover. The point of this lab is to be able to understand the traits of the fruit flies. By starting with two completely different fruit files that has caused eight different types of fruit flies. But how can there be that many types of fruit flies? Well it must have happened during a process called, “Cross Over”. Having a multitude of 8 different independent Assortments, will cause the offspring to have recombinant gametes or just takes the recessive/dominant genes from the parents. In this lab, the main purpose is to identify the traits of the fruit flies and find out how many kinds of crossovers will there be. From two main types of fruit flies, there are eight possibilities to of their offspring. Why eight possibilities? Since a parent can produce eight four different types of gametes (Two from crossing over and Two from no crossing over), the two completely different types of fruit flies (The wild type and the Mutant type) would have their own four set of gametes. (See the two pictures next to this frame for the difference.) By knowing this, their will be eight different types of flies produced from the parents. If there is no crossover between the mutant and the wild type, that means there the offspring will either have their parent’s recessive or dominant genes. With crossover genes, the offspring will have recombinant gametes. The frequency of the recombinant gametes is related to how far apart two genes are on the chromosome. So during the process of crossing over it will effect dramatically to the offspring’s traits. How it works with recombinant gametes is that father apart the two genes are, the two genes will have a greater chance to crossover. If the two genes are close together, will have a lesser chance to crossover. So what we are trying to understand from this amazing experiment is that we are trying to learn how the fruit flies are able to have these traits. Observed: Real Map Observed (Class’s Map) Tan Body, Vestigial Wings, Red Eyes Black Body, Normal Wings, Red Eyes All Mutant Type: Black Body, Vestigial Wings, Brown Eyes All Wild Type:Tan body, Normal Wings, Red Eyes Description: To be more organized, we labeled 8 areas to separate fruit flies by their traits. Description: to keep the fruit flies asleep, we closed the petri dish and placed fly nap inside it for five minutes. Expected Real Map Tan Body, Normal Wings, Brown Eyes Black Body, Vestigial Wings, Red Eyes Tan Body, Vestigial, Brown Eyes Results B + vg (*Expected & Observed=68*) (18.5 x 369)/100=68.265=68 (68-68)/68=0/68=0, Accepted X2= 0 B + bw (*Expected=207,Observed=70*) (56 x 369)/100=206.64=207 (207-70)/207=137/207=.6618357488=.66, Rejected X2= .66 Vg + bw (*Expected=138, Observed=71*) (37.5 x 369)/100 = 138.375 = 138 (138-71)/138 = 67/138 = .4855072464 = .49 Rejected X2= .49 In this experiment, we had encountered many mistakes. Our class results were least accurate due to bad observation. Such as identifying the eye color (look at the two images on the left), is difficult to differentiate the eye color. Same as the color of the body may be difficult to identify because the ebony black body of the mutant fly was hard to detect, however, in our analysis, b + vg data was correct (Look at the maps above)! There’s a difference in the percentage of the map. Again, it was probably because of the minor mistakes in our Class’s observations. We had about 369 flies, and we had 1/3 of our analysis correct! Discussion Brown Eyes Red Eyes UCRLxx-xxxxxxx