Download
1 / 37
380 likes | 523 Views
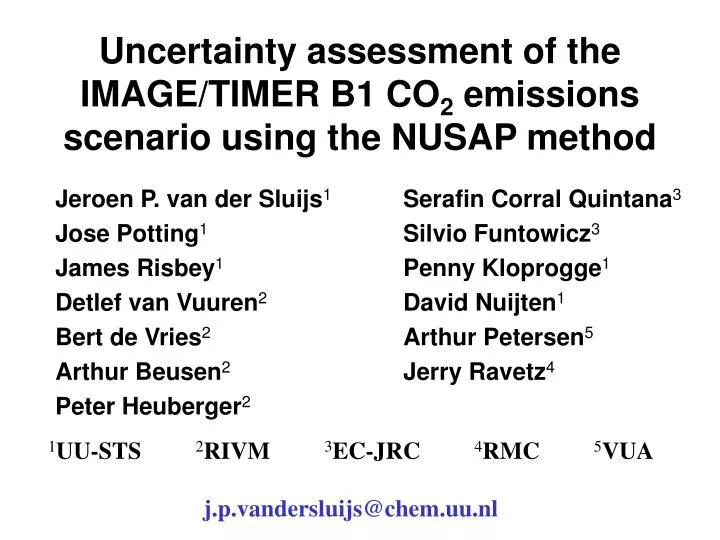
Uncertainty assessment of the IMAGE/TIMER B1 CO 2 emissions scenario using the NUSAP method. Jeroen P. van der Sluijs 1 Jose Potting 1 James Risbey 1 Detlef van Vuuren 2 Bert de Vries 2 Arthur Beusen 2 Peter Heuberger 2. Serafin Corral Quintana 3 Silvio Funtowicz 3 Penny Kloprogge 1

E N D
Uncertainty assessment of the IMAGE/TIMER B1 CO2 emissions scenario using the NUSAP method Jeroen P. van der Sluijs1 Jose Potting1 James Risbey1 Detlef van Vuuren2 Bert de Vries2 Arthur Beusen2 Peter Heuberger2 Serafin Corral Quintana3 Silvio Funtowicz3 Penny Kloprogge1 David Nuijten1 Arthur Petersen5 Jerry Ravetz4 1UU-STS 2RIVM3EC-JRC 4RMC 5VUA j.p.vandersluijs@chem.uu.nl
Objective Develop a framework for uncertainty assessment and management addressing quantitative & qualitative dimensions test & demonstrate usefulness in IA models
Population (Popher) World Economy (WorldScan) Change in GDP, population & others (i.e. scenario assumptions) Land demand, use & cover Energy demand & supply(TIMER) Land-use emissions Energy & industry emissions Feedbacks Emissions & land-use changes Carbon cycle Atmospheric chemistry Concentration changes Climate (Zonal Climate Model or ECBilt) Climatic changes Natural systems Agricultural Impacts Water Impacts Land degradation Sea level rise Impacts IMAGE 2: Framework of models and Linkages
TIMER Model : five submodels Fuel demand Population (POPHER) Energy Solid Fuel Demand (ED) supply (SF) Economy (WorldScan) Liquid Fuel Electric Power supply (LF) Generation (EPG) Electricity demand Gaseous Fuel supply (GF) Prices Inputs: Population, GDP capita-1, activity in energy sectors, assumptions regarding technological development, depletion and others. Outputs: End-use energy consumption, primary energy consumption.
Main objectives TIMER • To analyse the long-term dynamics of the energy system, and in particular changes in energy demand and the transition to non-fossil fuels within an integrated modeling framework; • To construct and simulate greenhouse gas emission scenarios that are used in other submodels of IMAGE 2.2 or that are used in meta-models of IMAGE;
Key questions • What are key uncertainties in TIMER? • What is the role of model structure uncertainties in TIMER? • Uncertainty in which input variables and parameters dominate uncertainty in model outcome? • What is the strength of the sensitive parameters (pedigree)?
Location of uncertainty • Input data • Parameters • Technical model structure • Conceptual model sruct. /assumptions • Indicators • Problem framing • System boundary • Socio-political and institutional context
Sorts of uncertainty • Inexactness • Unreliability • Value loading • Ignorance
Inexactness • Variability / heterogeneity • Lack of knowledge • Definitional vagueness • Resolution error • Aggregation error
Unreliability • Limited internal strength in: • Use of proxies • Empirical basis • Theoretical understanding • Methodological rigour (incl. management of anomalies) • Validation • Limited external strength in: • Exploration of rival problem framings • Management of dissent • Extended peer acceptance / stakeholder involvement • Transparency • Accessibility • Future scope • Linguistic imprecision
Value loading • Bias • In knowledge production • Motivational bias (interests, incentives) • Disciplinary bias • Cultural bias • Choice of (modelling) approach (e.g. bottom up, top down) • Subjective Judgement • In knowledge utilization • Strategic/selective knowledge use • Disagreement • about knowledge • about values
Ignorance • System indeterminacy • open endedness • chaotic behavior • Active ignorance • Model fixes for reasons understood • limited domains of applicability of functional relations • Surprise A • Passive ignorance • Bugs (numerical / software / hardware error) • Model fixes for reasons not understood • Surprise B
Method • Checklist for model quality assistance • Meta-level analysis SRES scenarios to explore model structure uncertainties • Global sensitivity analysis (Morris) • NUSAP expert elicitation workshop to assess pedigree of sensitive model components • Diagnostic diagram to prioritise uncertainties by combination of criticality (Morris) and strength (pedigree)
Checklist • Assist in quality control in complex models • Not models are good or bad but ‘better’ and ‘worse’ forms of modelling practice • Quality relates to fitness for function • Help guard against poor practice • Flag pittfalls
Checklist structure • Screening questions • Model & problem domain • Internal strength • Interface with users • Use in policy process • Overall assessment
(SRES scenarios reported to IPCC (2000) by six different modelling groups) Maria Message Aim Minicam ASF Image B1-marker (Van Vuuren et al. 2000)
Morris (1991) • facilitates global sensitivity analysis in minimum number of model runs • covers entire range of possible values for each variable • parameters varied one step at a time in such a way that if sensitivity of one parameter is contingent on the values that other parameters may take, Morris captures such dependencies
Most sensitive model components: • Population levels and economic activity • Intra-sectoral structural change • Progress ratios for technological improvements • Size and cost supply curves of fossil fuels resources • Autonomous and price-induced energy efficiency improvement • Initial costs and depletion of renewables
NUSAP: Pedigree Evaluates the strength of the number by looking at: • Background history by which the number was produced • Underpinning and scientific status of the number
Parameter Pedigree • Proxy • Empirical basis • Theoretical understanding • Methodological rigour • Validation
Proxy Sometimes it is not possible to obtain direct measurements or estimates of the parameter and so some form of proxy measure is used. Proxy refers to how good or close a measure of the quantity which we model is to the actual quantity we represent. An exact measure of the quantity would score four. If the measured quantity is not clearly related to the desired quantity the score would be zero.
Empirical basis Empirical quality typically refers to the degree to which direct observations are used to estimate the parameter. When the parameter is based upon good quality observational data, the pedigree score will be high. Sometimes directly observed data are not available and the parameter is estimated based on partial measurements or calculated from other quantities. Parameters determined by such indirect methods have a weaker empirical basis and will generally score lower than those based on direct observations.
Theoretical understanding The parameter will have some basis in theoretical understanding of the phenomenon it represents. This criterion refers to the extent en partiality of the theoretical understanding. Parameters based on well established theory will score high on this metric, while parameters whose theoretical basis has the status of crude speculation will score low.
Methodological rigour Some method will be used to collect, check, and revise the data used for making parameter estimates. Methodological quality refers to the norms for methodological rigour in this process applied by peers in the relevant disciplines. Well established and respected methods for measuring and processing the data would score high on this metric, while untested or unreliable methods would tend to score lower.
Validation This metric refers to the degree to which one has been able to cross-check the data against independent sources. When the parameter has been compared with appropriate sets of independent data to assess its reliability it will score high on this metric. In many cases, independent data for the same parameter over the same time period are not available and other datasets must be used for validation. This may require a compromise in the length or overlap of the datasets, or may require use of a related, but different, proxy variable, or perhaps use of data that has been aggregated on different scales. The more indirect or incomplete the validation, the lower it will score on this metric.
Elicitation workshop • 18 experts (in 3 parallel groups of 6) discussed parameters, one by one, using information & scoring cards • Individual expert judgements, informed by group discussion
Example result gas depletion multiplier Radar diagram: Each coloured line represents scores given by one expert Same data represented as kite diagram: Green = min. scores, Amber= max scores, Light green = min. scores if outliers omitted (Traffic light analogy)
Average scores (0-4) • proxy 2½ ±½ • empirical 2 ±½ • theory 2 ±½ • method 2 ±½ • validation 1 ±½ • valueladeness 2½ ±1 • competence 2 ±½
Conclusions (1) • Model quality assurance checklist proves quick scan to flag major areas of concern and associated pitfalls in the complex mass uncertainties. • Meta-level intercomparison of TIMER with the other SRES models gave us some insight in the potential roles of model structure uncertainties.
Conclusions (2) • Global sensitivity analysis supplemented with expert elicitation constitutes an efficient selection mechanism to further focus the diagnosis of key uncertainties. • Our pedigree elicitation procedure yields a differentiated insight into parameter strength.
Conclusions (3) • The diagnostic diagram puts spread and strength together to provide guidance in prioritisation of key uncertainties.
Conclusions (4) NUSAP method: • can be applied to complex models in a meaningful way • helps to focus research efforts on the potentially most problematic model components • pinpoints specific weaknesses in these components
More information: www.nusap.net