Download
1 / 9
90 likes | 94 Views
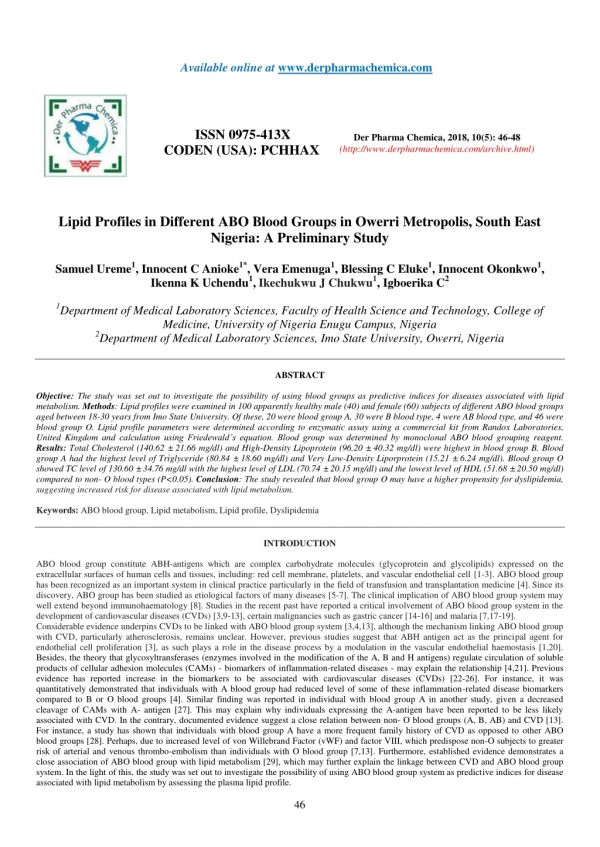
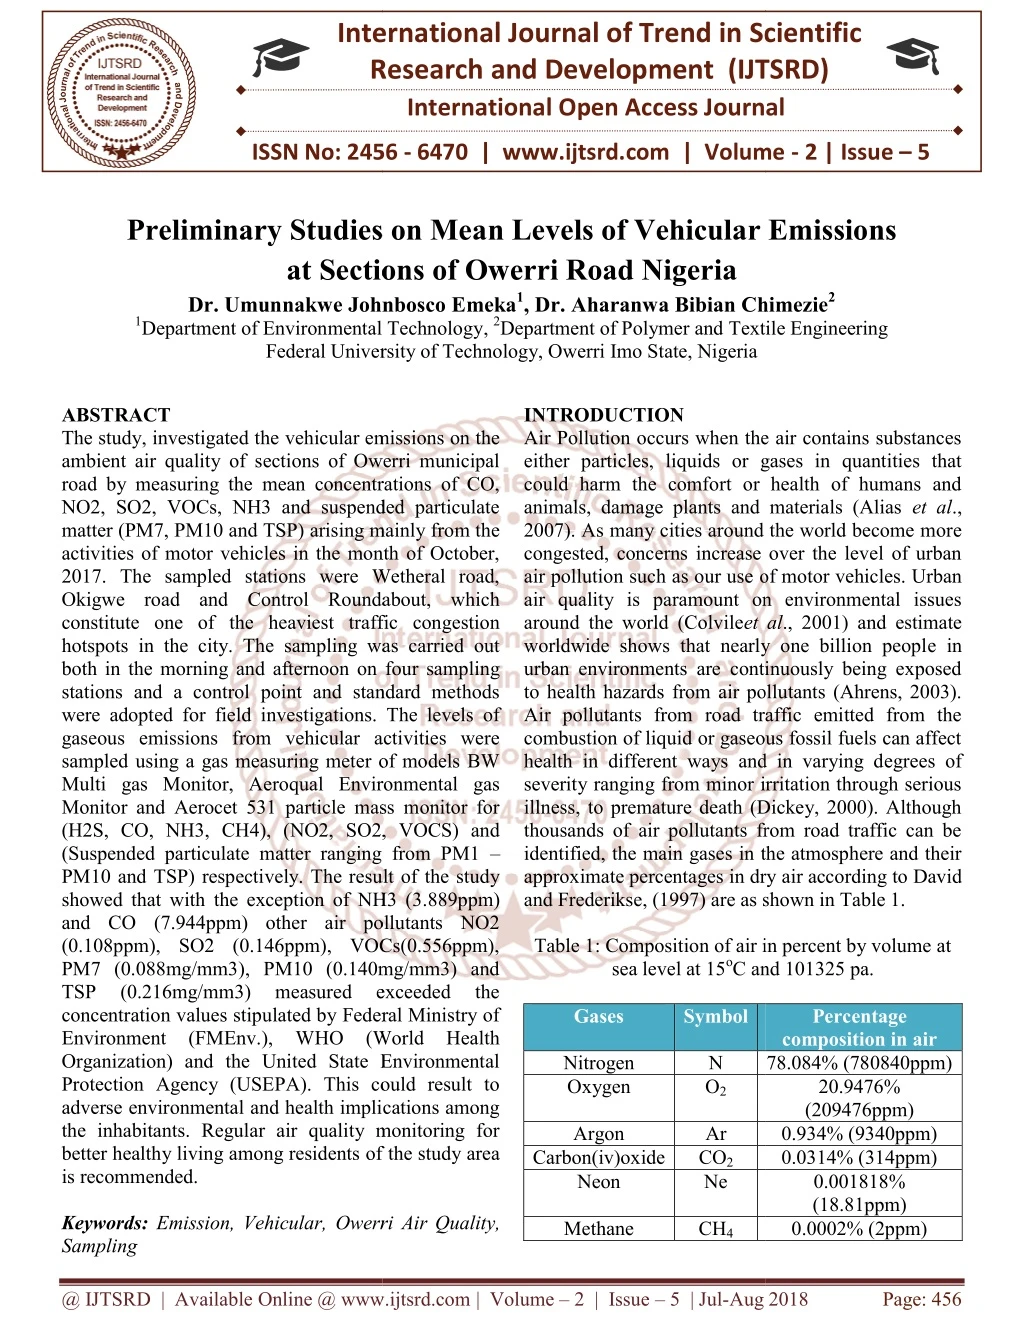
The study, investigated the vehicular emissions on the ambient air quality of sections of Owerri municipal road by measuring the mean concentrations of CO, NO2, SO2, VOCs, NH3 and suspended particulate matter PM7, PM10 and TSP arising mainly from the activities of motor vehicles in the month of October, 2017. The sampled stations were Wetheral road, Okigwe road and Control Roundabout, which constitute one of the heaviest traffic congestion hotspots in the city. The sampling was carried out both in the morning and afternoon on four sampling stations and a control point and standard methods were adopted for field investigations. The levels of gaseous emissions from vehicular activities were sampled using a gas measuring meter of models BW Multi gas Monitor, Aeroqual Environmental gas Monitor and Aerocet 531 particle mass monitor for H2S, CO, NH3, CH4 , NO2, SO2, VOCS and Suspended particulate matter ranging from PM1 PM10 and TSP respectively. The result of the study showed that with the exception of NH3 3.889ppm and CO 7.944ppm other air pollutants NO2 0.108ppm , SO2 0.146ppm , VOCs 0.556ppm , PM7 0.088mg mm3 , PM10 0.140mg mm3 and TSP 0.216mg mm3 measured exceeded the concentration values stipulated by Federal Ministry of Environment FMEnv. , WHO World Health Organization and the United State Environmental Protection Agency USEPA . This could result to adverse environmental and health implications among the inhabitants. Regular air quality monitoring for better healthy living among residents of the study area is recommended. Dr. Umunnakwe Johnbosco Emeka | Dr. Aharanwa Bibian Chimezie "Preliminary Studies on Mean Levels of Vehicular Emissions at Sections of Owerri Road Nigeria" Published in International Journal of Trend in Scientific Research and Development (ijtsrd), ISSN: 2456-6470, Volume-2 | Issue-5 , August 2018, URL: https://www.ijtsrd.com/papers/ijtsrd15745.pdf Paper URL: http://www.ijtsrd.com/other-scientific-research-area/enviormental-science/15745/preliminary-studies-on-mean-levels-of-vehicular-emissions-at-sections-of-owerri-road-nigeria/dr-umunnakwe-johnbosco-emeka<br>

E N D
International Research Research and Development (IJTSRD) International Open Access Journal Preliminary Studies on Mean Levels of Vehicular Emissions Sections of Owerri Road Nigeria Umunnakwe Johnbosco Emeka1, Dr. Aharanwa Bibian Chimezie Department of Environmental Technology, 2Department of Polymer and Textile Engineering Federal University of Technology, Owerri Imo State, Nigeria International Journal of Trend in Scientific Scientific (IJTSRD) International Open Access Journal ISSN No: 2456 ISSN No: 2456 - 6470 | www.ijtsrd.com | Volume 6470 | www.ijtsrd.com | Volume - 2 | Issue – 5 Preliminary Studies on Mea at Sections of Owerri Road Nigeria Dr. Umunnakwe Johnbosco 1Department of Environmental Technology Federal University of Technology, Owerri Imo State, Nigeria n Levels of Vehicular Emissions Aharanwa Bibian Chimezie2 Department of Polymer and Textile Engineering ABSTRACT The study, investigated the vehicular emissions on the ambient air quality of sections of Owerri municipal road by measuring the mean concentrations of CO, NO2, SO2, VOCs, NH3 and suspended particulate matter (PM7, PM10 and TSP) arising mainly from the activities of motor vehicles in the month of October, 2017. The sampled stations were Wetheral road, Okigwe road and Control Roundabout, which constitute one of the heaviest traffic congestion hotspots in the city. The sampling was carried out both in the morning and afternoon on four sampling stations and a control point and standard methods were adopted for field investigations. The levels of gaseous emissions from vehicular activities were sampled using a gas measuring meter of models BW Multi gas Monitor, Aeroqual Environmental gas Monitor and Aerocet 531 particle mass monitor for (H2S, CO, NH3, CH4), (NO2, SO2, VOCS) and (Suspended particulate matter ranging from PM1 PM10 and TSP) respectively. The result of the study showed that with the exception of NH3 (3 and CO (7.944ppm) other air pollutants NO2 (0.108ppm), SO2 (0.146ppm), VOCs(0.556ppm), PM7 (0.088mg/mm3), PM10 (0.140mg/mm3) and TSP (0.216mg/mm3) measured concentration values stipulated by Federal Ministry of Environment (FMEnv.), WHO (World Health Organization) and the United State Environmental Protection Agency (USEPA). This could result to adverse environmental and health implications among the inhabitants. Regular air quality monitoring for better healthy living among residents of the study area is recommended. Keywords: Emission, Vehicular, Owerri Sampling INTRODUCTION Air Pollution occurs when the air contains substances either particles, liquids or gases in quantities that could harm the comfort or health of humans and animals, damage plants and materials (Alias 2007). As many cities around the world become mor congested, concerns increase over the level of urban air pollution such as our use of motor vehicles. Urban air quality is paramount on environmental issues around the world (Colvileet al worldwide shows that nearly one billion peopl urban environments are continuously being exposed to health hazards from air pollutants (Ahrens, 2003). Air pollutants from road traffic emitted from the combustion of liquid or gaseous fossil fuels can affect health in different ways and in varying d severity ranging from minor irritation through serious illness, to premature death (Dickey, 2000). Although thousands of air pollutants from road traffic can be identified, the main gases in the atmosphere and their approximate percentages in dry and Frederikse, (1997) are as shown in Table 1. Table 1: Composition of air in percent by volume at sea level at 15oC and 101325 pa. Gases Symbol vehicular emissions on the Air Pollution occurs when the air contains substances either particles, liquids or gases in quantities that could harm the comfort or health of humans and animals, damage plants and materials (Alias et al., 2007). As many cities around the world become more congested, concerns increase over the level of urban such as our use of motor vehicles. Urban air quality is paramount on environmental issues et al., 2001) and estimate worldwide shows that nearly one billion people in urban environments are continuously being exposed to health hazards from air pollutants (Ahrens, 2003). Air pollutants from road traffic emitted from the combustion of liquid or gaseous fossil fuels can affect health in different ways and in varying degrees of severity ranging from minor irritation through serious illness, to premature death (Dickey, 2000). Although thousands of air pollutants from road traffic can be the main gases in the atmosphere and their approximate percentages in dry air according to David and Frederikse, (1997) are as shown in Table 1. ambient air quality of sections of Owerri municipal road by measuring the mean concentrations of CO, NO2, SO2, VOCs, NH3 and suspended particulate matter (PM7, PM10 and TSP) arising mainly from the ies of motor vehicles in the month of October, 2017. The sampled stations were Wetheral road, Okigwe road and Control Roundabout, which constitute one of the heaviest traffic congestion hotspots in the city. The sampling was carried out and afternoon on four sampling stations and a control point and standard methods were adopted for field investigations. The levels of gaseous emissions from vehicular activities were sampled using a gas measuring meter of models BW qual Environmental gas Monitor and Aerocet 531 particle mass monitor for (H2S, CO, NH3, CH4), (NO2, SO2, VOCS) and (Suspended particulate matter ranging from PM1 – PM10 and TSP) respectively. The result of the study showed that with the exception of NH3 (3.889ppm) and CO (7.944ppm) other air pollutants NO2 (0.108ppm), SO2 (0.146ppm), VOCs(0.556ppm), PM7 (0.088mg/mm3), PM10 (0.140mg/mm3) and TSP (0.216mg/mm3) measured concentration values stipulated by Federal Ministry of Table 1: Composition of air in percent by volume at C and 101325 pa. exceeded exceeded the the Percentage composition in air 78.084% (780840ppm) 20.9476% (209476ppm) 0.934% (9340ppm) 0.0314% (314ppm) 0.001818% (18.81ppm) 0.0002% (2ppm) HO (World Health Organization) and the United State Environmental Protection Agency (USEPA). This could result to adverse environmental and health implications among the inhabitants. Regular air quality monitoring for Nitrogen Oxygen N O2 Argon Ar CO2 Ne of the study area Carbon(iv)oxide Neon Owerri Air Quality, Methane CH4 @ IJTSRD | Available Online @ www.ijtsrd.com @ IJTSRD | Available Online @ www.ijtsrd.com | Volume – 2 | Issue – 5 | Jul-Aug 2018 Aug 2018 Page: 456
International Journal of Trend in Scientific Research and Development (IJTSRD) ISSN: 2456-6470 areas which can contribute to high level of urban air pollution, adverse socioeconomic, environmental, health, and welfare impacts. In city centres and congested streets, traffic can be responsible for 80-90 % of these pollutants and this situation is particularly severe in cities in developing countries (White legg and Haq, 2003). Traffic congestion in Owerri increases vehicle emissions and degrades ambient air quality, and recent studies in other cities of Nigeria, have shown excess morbidity and mortality for drivers, commuters and individuals living near major roadways (Asheshi, 2012). contribute about 50 to 80% of NO2 and CO concentration in developing countries (Fu, 2001; Goyal, 2006).Furthermore, in developing countries the super emitters contribute about 50% of harmful emissions to the entire average emission (Brunekreef, 2005).AQI is an index (Tables 2,3) for reporting daily air quality in the United States (USEPA, 2003). AQI Range Air Quality Condition 0 – 50 51 – 100 101 – 150 Unhealthy for sensitive group 151 – 200 201 – 300 301 – 500 Source: USEPA (2003) Gases Symbol Percentage composition in air 0.000524% (5.24ppm) 0.000114% (1.14ppm) 0.00005% (0.5ppm) 0.0000087% (0.087ppm) 0.000007% (0.07ppm) 0.000002% (0.02ppm) Helium Krypton Hydrogen Xenon He Kr H Xe Ozone Nitrogen dioxide Iodine Carbon monoxide Ammonia Source: David and Frederikse, (1997) O3 NO2 I2 CO 0.000001% (0.01ppm) Trace Traffic emissions NH3 Trace Road traffic is the dominant, if not the most important, anthropogenic source of CO, NOx and HCin urban areas which are emitted in close proximity to human receptors, which enhances exposure levels (Fenger, 1999,Rouphailet al, 2001). The health challenges faced by road users, passers-by, residents and business operators in traffic flash points, having high concentration of vehicular traffic during some periods of the day are worrisome issues (Utang and Peterside, 2011). Vehicular emissions are significant contributors to Ambient air Quality Index (AQI) especially in urban Good Moderate Unhealthy Very unhealthy Hazardous Table 2: Interpretations of the AQI values classification USEPA (2003) AQI Category AQI Rating CO (ppm) Good Moderate Unhealthy for sensitive groups Unhealthy Very unhealthy Hazardous Source: USEPA (2003) Index Values 0 – 50 51 – 100 101 – 150 151 – 200 201 – 300 301 – 500 NO2 (ppm) 0 – 0.053 0.054 – 0.1 0.101 – 0.36 0.076– 0.185 12.5 – 15.4 0.361 – 0.64 0.186 – 0.304 15.5 – 30.4 0.65 – 1.24 30.5- 50.4 1.25 – 2.04 SO2 (ppm) 0 – 0.035 0.036– 0.075 A B C D E F 0 – 4.4 4.5 – 9.4 9.5 – 12.4 0.305 – 0.604 0.605 – 1.004 Table 3 shows the Nigerian National Ambient Air Quality approved Standards by the Federal Ministry of Environment according to Nwachukwuetal., (2012). Table 3: Nigerian National Ambient Air Quality Standards. Pollutants Averaging time Particulates Sulphur dioxide (SO2) Nitrogen dioxide (NO2) Carbon monoxide (CO) Hydrocarbon Photochemical oxidants Limits 250ug/m3 0.01-0.1ppm 0.04-0.06ppm 10-20ppm 0.6ppm 0.06ppm 1hour 1-24 hours 1-24 hours 1-8 hours 3 hours 1 hour @ IJTSRD | Available Online @ www.ijtsrd.com | Volume – 2 | Issue – 5 | Jul-Aug 2018 Page: 457
International Journal of Trend in Scientific Research and Development (IJTSRD) ISSN: 2456 International Journal of Trend in Scientific Research and Development (IJTSRD) ISSN: 2456 International Journal of Trend in Scientific Research and Development (IJTSRD) ISSN: 2456-6470 In Nigeria little reference is made on damage of pollution caused by mobile transportation so air pollution (Faboye, Magbabeola, 2001). In other studies, only casual references are made to the gravity of the problem of pollution from mobile transportation sources (World Bank, 1995; Garba and Garba, 2001). STUDY AREA Owerri is the capital of Imo state in Nigeria, situated in the South-eastern part of Nigeria. Owerri, state’s largest city consists of three Local Government Areas including Owerri Municipal, Owerri North and Owerri West (Fig.1). It has an estimated population of about 401,873 as of 2006 and is approximately 100 square kilometres (40sq mi) in area (Wikipedia, 2016).Some major roads that transverse the city are; In Nigeria little reference is made on damage of pollution caused by mobile transportation sources of rt Harcourt Road, Aba Road, Onitsha Road and Okigwe Road. Some busy roads within the city are Douglas Road, Wetheral Road, Tetlow Road and Port Harcourt Road, Aba Road, Onitsha Road and Okigwe Road. Some busy roads within the city are Douglas Road, Wetheral Road, Tetlow Road and Works Road. Owerri falls within the rain forest and produces many agricultural products, such as yam, cassava, corn rubber and palm products. Owerri has a tropical wet climate according to the Koppen falls for most months of the year with a brief dry season. The Harmattan affects the city in the early periods of the dry season and it is noticeably pronounced than in other cities in Nigeria. annual temperature rangs between 26 humidity that varies between 50.5 municipal is characterized by influx of people and high volume of vehicular flows in and out of th high volume of vehicular flows in and out of the area. 1997; Iyoha, Iyoha, 2000; 2000; In other studies, only casual references are made to the gravity of the problem of from mobile transportation sources (World Owerri falls within the rain forest and produces many agricultural products, such as yam, cassava, corn, rubber and palm products. Owerri has a tropical wet climate according to the Koppen-Geiger system. Rain falls for most months of the year with a brief dry season. The Harmattan affects the city in the early periods of the dry season and it is noticeably less pronounced than in other cities in Nigeria. The mean annual temperature rangs between 26 – 28 oC, with humidity that varies between 50.5 – 70.5 %.Owerri municipal is characterized by influx of people and Owerri is the capital of Imo state in Nigeria, situated eastern part of Nigeria. Owerri, the state’s largest city consists of three Local Government as including Owerri Municipal, Owerri North and Owerri West (Fig.1). It has an estimated population of about 401,873 as of 2006 and is approximately 100 square kilometres (40sq mi) in area (Wikipedia, 2016).Some major roads that transverse the city are; Figure 1: Map of Imo state showing the study area Figure 1: Map of Imo state showing the study area @ IJTSRD | Available Online @ www.ijtsrd.com @ IJTSRD | Available Online @ www.ijtsrd.com | Volume – 2 | Issue – 5 | Jul-Aug 2018 Aug 2018 Page: 458
International Journal of Trend in Scientific Research and Development (IJTSRD) ISSN: 2456-6470 with alarm set at 5.00 and 20.00 mg/m3. Measurements were done by holding the sensor to a breathing height of about 1.5 meters in the direction of the prevailing wind and reading was recorded when the monitor had warmed up (3minutes) to burn off contaminants on the sensor and air sucked into the sensor. An Aeroqual Environmental gas Monitor equipped with infrared sensor was used for the measurement of NO2. The technique operates on the principle of dual wavelength IR Absorption, having range of detection between 0.001 – 1 mg/m3 with alarm set at 0.002 and 1.000 mg/m3. Measurements were done by holding the sensor to a breathing height of about 1.5 meters in the direction of the prevailing wind. Reading was recorded when the monitor had warmed up (3minutes) to burn off contaminants on the sensor and air sucked into the sensor. A BW Multi gas Monitor equipped with photochemical sensor was used for the measurement of H2S. Measurements were done by holding the sensor to a breathing height of about 1.5 meters in the direction of the prevailing wind, with readings recorded when the monitor had warmed up. A BW Multi gas Monitor equipped with photochemical sensor was used for the measurement ofNH3. The range of detection is between 1.0- 25 ppm with alarm set at 2 and 10 ppm. Measurements were done by holding the sensor to a breathing height of about 1.5 meters in the direction of the prevailing wind and readings was recorded when the monitor had warmed up sensors. Aeroqual Environmental gas Monitor equipped with infrared sensor was used for the measurement of VOCs. The Equipment operates on the principle of dual wavelength IR Absorption, The range of detection is between 0.1-1000 mg/m3 with alarm set at 0.20 and 50.00 mg/m3. Measurements were done by holding the sensor to a breathing height of about 1.5 meters in the direction of the prevailing wind, and readings were recorded when the monitor had warmed up (3minutes) to burn off contaminants on the sensor and air sucked into the sensor. METHODOLOGY In situ measurement of concentrations of CO, NO2 and SO2 which characterize the major pollutant gases of vehicular emission was carefully carried out.Five sampling stations(Table 4) were selected and the criteria for their choice was based on traffic intensity, peak period of time and road network. Table 4: Location of Areas/Sampling points. S/N Sample Locations points 1 Service Roundabout 2 Junction P4 3 Okigwe Junction 4 Control Roundabout P8 Sample Description SPL1 - Fire P1 P2 Along Egbu Road Fire Service by Wetheral MCC Road by Wetheral Along MCC Road Along Bank Road Okigwe by Wetheral Control By PHC Road Control By Onitsha Road FUTO – ASUU Secretariat SPL2 – MCC P3 SPL3 – P5 P6 SPL4 – P7 5 SPL0 – Control P0 Methods of Measurement Suspended Particulate Matter (SPM) was measured using an Aerocet 531 particle mass monitor to measure respirable and total suspended particle. Measurements were done by holding the sensor to a height of about two meters in the direction of the prevailing wind and readings recorded at point of stability. The following noxious gases; Carbon Monoxide (CO), Sulphur oxides (SOx), Nitrogen Dioxides (NO2), Hydrogen Sulphide (H2S), Methane (CH4), Ammonia (NH3) and Volatile Organic Compounds (VOCs) were measured using Standard methods as described below. A BW Multi gas Monitor with range of detection 0.1 – 100 ppm equipped with photochemical sensor was used for the measurement of CO. Measurements were done by holding the sensor to a breathing height of about 1.5 meters in the direction of the prevailing wind, while readings was recorded at stability when the monitor had warmed up sensors and air pumped into the sensor. An Aeroqual Environmental gas Monitor equipped with infrared sensor was used for the measurement of SO2. The technique operates on the principle of dual wavelength IR Absorption, having detection range between 0.01 – 1000 mg/m3 Figure 2: Calibrated Equipment Used for the Study. @ IJTSRD | Available Online @ www.ijtsrd.com | Volume – 2 | Issue – 5 | Jul-Aug 2018 Page: 459
International Journal of Trend in Scientific Research and Development (IJTSRD) ISSN: 2456 International Journal of Trend in Scientific Research and Development (IJTSRD) ISSN: 2456 International Journal of Trend in Scientific Research and Development (IJTSRD) ISSN: 2456-6470 RESULTS AND DISCUSSION TABLE 4: THE MEAN VALUES OF THE POLLUTANTS TIMEPM7PM10 A 0.075 M 0.210 M 0.016 A 0.084 M 0.079 A 0.101 M 0.134 A 0.092 M 0.048 0.061 0.115 0.096 0.480 0.750 0.000 M= Morning A= Afternoon TABLE 4: THE MEAN VALUES OF THE POLLUTANTS PM10TSP 0.170 0.317 0.107 0.140 0.200 0.000 0.313 0.423 0.107 0.130 0.200 0.000 0.018 0.019 0.055 0.010 2.000 1.000 0.064 0.116 0.122 0.070 0.600 0.500 0.099 0.121 0.117 0.065 0.400 0.500 0.189 0.308 0.108 0.000 0.150 0.500 0.217 0.318 0.156 0.000 0.150 0.500 0.125 0.208 0.098 0.420 0.550 0.000 STATION CONTROL JUNCT CONTROL JUNCT FUTO MCC MCC OKIGWE ROAD OKIGWE ROAD WETHERAL WETHERAL NO2 SO2VOCH2S CO 4.500 4.000 1.000 10.500 4.500 0.500 11.500 6.000 0.500 7.500 3.500 0.000 12.500 3.500 0.000 8.500 3.000 0.000 12.500 4.000 0.000 NH3 5.000 0.500 5.500 0.500 1.000 1.000 CH4 TIME DATA ANALYSIS OF THE SAMPLED STATIONS THE SAMPLED STATIONS TIME DATA OF OKIGWE ROAD TIME DATA OF OKIGWE ROAD-FUTO 100.0 80.0 60.0 40.0 20.0 0.0 % OF PM7 % OF PM10 % OF % OF TSP TSP % OF NO2 % OF SO2 % OF VOC % OF H2S % of CO2 % OF NH3 % OF CH4 OKIGWE ROAD OKIGWE ROAD OKIGWE ROAD FUTO Figure 3:Time Data analysis of Okigwe road Figure 3:Time Data analysis of Okigwe road – FUTO TIME DATA WETHERAL TIME DATA WETHERAL -FUTO 100.0 90.0 80.0 70.0 60.0 50.0 40.0 30.0 20.0 10.0 0.0 % OF PM7 % OF PM10 % OF TSP TSP % OF % OF NO2 % OF SO2 % OF VOC % OF H2S % of CO2 % OF NH3 % OF CH4 WETHERAL WETHERAL FUTO Figure 4:Time Data analysis of Wetheral Road Figure 4:Time Data analysis of Wetheral Road - FUTO @ IJTSRD | Available Online @ www.ijtsrd.com @ IJTSRD | Available Online @ www.ijtsrd.com | Volume – 2 | Issue – 5 | Jul-Aug 2018 Aug 2018 Page: 460
International Journal of Trend in Scientific Research and Development (IJTSRD) ISSN: 2456 Journal of Trend in Scientific Research and Development (IJTSRD) ISSN: 2456 Journal of Trend in Scientific Research and Development (IJTSRD) ISSN: 2456-6470 The analysis was done at the time the pollutants were sampled with respect to morning and afternoon hours. The result shows that the concentration of these pollutants in this region is specifically higher in the morning hours than in the afternoon hours, for particulate matter, but other pollutants showed higher values in the afternoon and along Wetheral due to the increase of gas emission from cars of people driving to their places of is primarily produced by mechanical processes such as construction activities, which produces road dust transported by wind(Mishra,2008), whereas the latter originates primarily from combustion produces road dust transported by wind(Mishra,2008), whereas the latter originates primarily from combustion The analysis was done at the time the pollutants were sampled with respect to morning and afternoon hours. hese pollutants in this region is specifically higher in the morning hours than in the afternoon hours, for particulate matter, but other pollutants showed higher values in the The analysis was done at the time the pollutants were sampled with respect to morning and afternoon hours. The result shows that the concentration of t hours than in the afternoon hours, for particulate matter, but other pollutants showed higher values in the afternoon and along Wetheral due to the increase of gas emission from cars of p works. Particulate matter is primarily produced by mechanical processes such as construction activities, which produces road dust transported by wind(Mishra,2008), whereas the latter originates primarily from combustion sources. eople driving to their places of is primarily produced by mechanical processes such as construction activities, which TIME DATA OF CONTROL TIME DATA OF CONTROL-FUTO 100.0 90.0 80.0 70.0 60.0 50.0 40.0 30.0 20.0 10.0 0.0 % OF PM7 % OF PM10 % OF TSP TSP % OF % OF NO2 % OF SO2 % OF VOC % OF H2S % of CO2 % OF NH3 % OF % OF CH4 CONTROL JUNCTION CONTROL JUNCTION CONTROL JUNCTION FUTO Figure 5: Time Data Analysis of Control Figure 5: Time Data Analysis of Control – FUTO TIME DATA OF MCC-FUTO 70.0 60.0 50.0 40.0 30.0 20.0 10.0 0.0 % OF PM7 % OF PM10 % OF TSP TSP % OF % OF NO2 % OF SO2 % OF VOC % OF H2S % of CO2 % OF NH3 % OF % OF CH4 MCC MCC FUTO Figure 6: Time Data Analysis of MCC Figure 6: Time Data Analysis of MCC – FUTO. The results further showed a comparison of all the sites with respect to the NAAQ standard. The results of the study showed that all the sites exceeded the of the study showed that all the sites exceeded the average concentration level of NO except in FUTO which was within the range. Th reason for the high concentration of NO reason for the high concentration of NO2 in these sites The results further showed a comparison of all the sites with respect to the NAAQ standard. The results average concentration level of NO2set bythe standard except in FUTO which was within the range. The @ IJTSRD | Available Online @ www.ijtsrd.com @ IJTSRD | Available Online @ www.ijtsrd.com | Volume – 2 | Issue – 5 | Jul-Aug 2018 Aug 2018 Page: 461
International Journal of Trend in Scientific Research and Development (IJTSRD) ISSN: 2456 Journal of Trend in Scientific Research and Development (IJTSRD) ISSN: 2456 Journal of Trend in Scientific Research and Development (IJTSRD) ISSN: 2456-6470 is as a result of high temperature combustion in automobile engines. The SO2 level in all the sites exceeded the 24 hour averaging time of 0.02 ppm in the morning and afternoon except for FUTO and Okigwe Road which fell below or has no SO2concentration according to the NAAQS standard. This is totally different in the case of Wetheral which had the highest concentration of all the sites both in the morning and afternoon times followed by Control Junction and MCC. Similarly, a survey conducted by Abam and Unachukwu (2009) in Calabar revealed a rise in the concentration of NO2 and SO highly congested traffic points. When assessed using Air Quality Index, the concentration of SO between 0.04ppm to 0.15ppm (poor to very poor). Similarly, NO2 ranged from poor to very poor at concentrations of between 0.02ppm – CO level in all the sites exceeds the 1 hour averaging time of 10ppm in the morning except for Control junction and FUTO, but the CO level in all the site is below the 1 hour averaging time of 10ppm excepts for MCC which is above the standard. The high concentration of CO in the affected areas is as a result of incomplete combustion of fossil fuel in automobile of incomplete combustion of fossil fuel in automobile is as a result of high temperature combustion in which occurs all through the day. The same is observed for the 8 hours averaging time of 20ppm for were below the WHO standard limit. A similar work by Ndoke and Jimoh (2000) at Minna, a city in Nigeria showed that the maximum for CO emission obtained was 15ppm which is also still lower than the base line of 48ppm stipulated by WHO and 20ppm stipulated by Federal Environmental Protection Agency of Nigeria (FEPA, 1991). The implication of this is that in as much as daily in these areas to carry out their business activities, they are constantly exposed to these concentrations of pollutants which are released at ground level (i.e. human breathing level) with their implication 2012). An individual’s exposure to a CO level as recorded in the sites (above 20 ppm) is capable of causing headache, dizziness and exertion. It may even be severe in individuals with health conditions such as asthma. The average distribution pollutants (Figs.7, 8) shows the variations as a result of location and time of engines which occurs all through the day. The same is observed for the 8 hours averaging time of 20ppm for which all parameters were below the WHO standard limit. A similar work by Ndoke and Jimoh (2000) at Minna, a city in Nigeria showed value for CO emission obtained was 15ppm which is also still lower than the base line of 48ppm stipulated by WHO and 20ppm stipulated by Federal Environmental Protection Agency of Nigeria (FEPA, 1991). The implication of this is that in as much as people subsist daily in these areas to carry out their business activities, they are constantly exposed to these concentrations of pollutants which are released at ground level (i.e. human breath attendant health implication Chukwuocha,2012). An individual’s exposure to a CO level as recorded in the sites (above 20 ppm) is capable of causing headache, dizziness and exertion. It may even be severe in individuals with health conditions such as asthma. The average distribution and trend analysis of the pollutants ( the variations as a result of location and time of sampling. level in all the sites exceeded the 24 hour averaging time of 0.02 ppm in the morning and afternoon except for FUTO and kigwe Road which fell below or has no concentration according to the NAAQS standard. This is totally different in the case of Wetheral which had the highest concentration of all the sites both in the morning and afternoon times followed by Control Similarly, a survey conducted by Abam and Unachukwu (2009) in Calabar revealed a and SO2 especially at highly congested traffic points. When assessed using Air Quality Index, the concentration of SO2 ranged ween 0.04ppm to 0.15ppm (poor to very poor). ranged from poor to very poor at (Nwachukwu & – 0.09ppm.The CO level in all the sites exceeds the 1 hour averaging time of 10ppm in the morning except for Control FUTO, but the CO level in all the site is below the 1 hour averaging time of 10ppm excepts for MCC which is above the standard. The high concentration of CO in the affected areas is as a result Average distribution of the pollutants Average distribution of the pollutants 70.000 60.000 50.000 40.000 30.000 20.000 10.000 0.000 % OF PM7 % OF PM10 % OF TSP % OF NO2 % OF SO2 % OF VOC % OF H2S % OF CO % OF NH3 % OF NH3 % OF CH4 CONTROL JUNCTION CONTROL JUNCTION FUTO MCC OKIGWE ROAD WETHERAL Figure 7: Average distribution of pollutants Figure 7: Average distribution of pollutants @ IJTSRD | Available Online @ www.ijtsrd.com @ IJTSRD | Available Online @ www.ijtsrd.com | Volume – 2 | Issue – 5 | Jul-Aug 2018 Aug 2018 Page: 462
International Journal of Trend in Scientific Research and Development (IJTSRD) ISSN: 2456 Journal of Trend in Scientific Research and Development (IJTSRD) ISSN: 2456 Journal of Trend in Scientific Research and Development (IJTSRD) ISSN: 2456-6470 Trend analysis of pollutants Trend analysis of pollutants 70.000 60.000 50.000 40.000 30.000 20.000 10.000 0.000 % OF PM7 % OF PM10 % OF TSP % OF TSP % OF NO2 % OF SO2 % OF VOC % OF H2S % OF CO % OF NH3 % OF NH3 % OF CH4 CONTROL JUNCTION FUTO MCC OKIGWE ROAD WETHERAL WETHERAL Figure 8: Trend analysis of pollutants. Figure 8: Trend analysis of pollutants. CONCLUSIONS From the reported study, air quality in Owerri Municipal, varied in space and time. Though areas around the Control Junction and the Wetheral Junction experienced high traffic congestion and low air quality in most times of the day, the study from the monitoring of the sites indicated that the average distribution of the pollutants varied with respect to the location. Control Junction concentration of PM7, PM10 and TSP, as a result of mechanical and construction activities being carried out in this area. Okigwe Road had the highest concentration of NO2, Wetheral Junction had the highest concentration of SO2, while FUTO had the highest concentration of VOC, CH4and H result indiscriminate dumping of waste around the school environment. MCC concentration of CO followed closely by Wetheral and Okigwe. MCC and Control has the same concentration level of NH3.When compared with National Ambient Air Quality Standards, the pollutants exceeded the concentration limits required for healthy air quality. However, because some residences and structural facilities were situated close to the study locations, background concentrations in those areas were high when compared to other background locations; this is because the dispersion of these pollutants was at a lower rate. RECOMMENDATIONS In order to mitigate the problems/challenges posed by vehicular traffic emissions in Owerri, vehicular traffic can be mitigated if emission standards are set and enforced by the relevant agents of government. Such measure will require all vehicles to pass an emission test to be deemed fit to ply the road. This will encourage vehicle owners to carry out regular maintenance checks on their vehicles. measures include, improvement in public transport operation, funding of research by government, land use planning, promoting public awareness and education and vehicle age REFERENCES 1.Abam, F. I. and Nwachukwu, G. Vehicular emission and air quality standards in Nigeria. European Journal of Scientific Research 34(4):550- 560. From the reported study, air quality in Owerri Municipal, varied in space and time. Though areas around the Control Junction and the Wetheral Junction experienced high traffic congestion and low air quality in most times of the day, the study from the nitoring of the sites indicated that the average distribution of the pollutants varied with respect to the location. Control Junction In order to mitigate the problems/challenges posed by vehicular traffic emissions in Owerri, emissions from traffic can be mitigated if emission standards are set and enforced by the relevant agents of government. Such measure will require all vehicles to pass an emission test to be deemed fit to ply the road. This will encourage vehicle owners to carry out lar maintenance checks on their vehicles. Other improvement in public transport operation, funding of research by government, land use planning, promoting public awareness and had had the the highest highest and TSP, as a result of mechanical and construction activities being carried t in this area. Okigwe Road had the highest Junction had the FUTO had the and H2S; as a result indiscriminate dumping of waste around the school environment. MCC concentration of CO followed closely by Wetheral and Okigwe. MCC and Control has the same Nwachukwu, G. O. (2009). has has the the highest highest Vehicular emission and air quality standards in European Journal of Scientific Research .When compared with lity Standards, the 2.Alias, M., Hamzah, Z. and Kenn, L. PM10 and total suspended particulates (TSP) measurement in various pow Journal of Analytical Sciences, Journal of Analytical Sciences, 11(1):255 – 261. Alias, M., Hamzah, Z. and Kenn, L. S. (2007). PM10 and total suspended particulates (TSP) measurement in various power stations. Malaysian pollutants exceeded the concentration limits required for healthy air quality. However, because some residences and structural facilities were situated close to the study locations, background concentrations in 3.Ahrens, C. D. (2003). Meteorology Today Introduction to Weather, Climate and the Environment, 7th edition, Thomson Brooks/Cole, pp.20-24. D. (2003). Meteorology Today - An Introduction to Weather, Climate and the Environment, 7th edition, Thomson Brooks/Cole, n compared to other background locations; this is because the dispersion of @ IJTSRD | Available Online @ www.ijtsrd.com @ IJTSRD | Available Online @ www.ijtsrd.com | Volume – 2 | Issue – 5 | Jul-Aug 2018 Aug 2018 Page: 463
International Journal of Trend in Scientific Research and Development (IJTSRD) ISSN: 2456-6470 4.Asheshi, O. O. (2012). Measurement of Traffic Emission in Lafia Metropolis. Journal of Science and Multidisciplinary Research. 4:34-44 Nigeria‟s Petroleum Resources organized by the Department of Economics, Delta State University. 15.Magbabeola N. O (2001). The use of Economic Instruments for Industrial pollution Abatement in Nigeria: Application to the Lagos Lagoon. Selected papers, Annual Conferences of the Nigerian Economic Society held in Port-Harcourt. 5.Brunekreef, B. (2005). Out of Africa, Occupation and Environmental Medicine.62:351- 352. BMJ publishing group. 6.Colvile, R. N., Hutchinson, E. J., Mindell, J. S. & Warren, R. F. (2001) The transport sector as a source of pollution, Atmospheric environment, vol. 35, pp. 1537 – 1565 16.Mishra, P. C. (2008). Fundamentals or Air and Water Pollution, New Delhi: APH publishers limited. P. 7-17. 7.David, R. L. and Frederikse, H. P. R. (1997). Handbook of Chemistry and Physics.28th Edition. 17.Ndoke P. N. and Jimoh D.O. (2000). Impact of Traffic Emission on Air Quality in a Developing City of Nigeria. Unpublished paper presented at the Department of Civil Engineering, Federal University of Technology Minna, Nigeria. 8.Dickey, J. H. (2000) Selected topics related to occupational exposures - part vii: air pollution: overview of sources and health, DM Disease - Mouth, vol. 46, No. 9, pp.556 – 589. 18.Nwachukwu, A. N., Chukwuocha, E. O. and Igbudu, O. (2012). A survey on the effects of air pollution on diseases of the people of Rivers State, Nigeria. African Journal of Environmental Science and Technology Vol. 6(10):371-379. 9.Faboye, O. O. (1997). Industrial pollution and waste management. PP 26-35 in Akinjide Osuntogun (ed.). Dimensions of Environmental Problems in Nigeria, Ibadan Davidson press limited, Nigeria. 19.Rouphail, N. M., Frey, H. C., Colyar, J. D. and Unal, a (2001). Vehicle emissions and traffic measures: Exploratory observation at signalized arterials. Paper presented at the 80th Annual Meeting of the Transportation Research Board. 10.Fenger, J. (1999). Urban Air Quality, Atmospheric Environment, Vol. 33, PP. 4877- 4900 analysis of field 11.FEPA (1991). Guidelines and standards for environmental pollution Nigeria. Federal Environmental Agency press, LagosFu, L. (2001). Assessment of Vehicle Pollution in China. Journal of the Air and Waste Management: 51(5):658 – 668. control in Protection 20.USEPA (2003). Guideline for Reporting Daily Air Quality. Air Quality Index (AQI), EPA454/k-03- 002, Office of Air Quality Planning and Standards: Research Triangle Park, NC. 12.Garba, A. G. and Garba, P. K. (2001). Market Failure and Air Pollution in Nigeria: A theoretical investigation of two cases, selected papers, Annual Conference of Nigerian Economic Society, held in Port-Harcourt. 21.Utang, P. B., and Peterside, K. S. (2011). Spatio- temporal variations in urban vehicular. Ethiopian Journal of Environmental Management, 4(2). Studies and 22.WHO (2004). Health Aspects of Air Pollution: Results from the WHO project. “Systematic Review of Health Aspects of Air Pollution in Europe”. 13.Goyal, S. (2006). Understanding urban vehicular pollution problem vis-à-vis ambient air quality. Case study of megacity Environmental monitoring 119:557-569. (Delhi, and India). assessment, 23.World Bank (1995). Defining Environmental Development Strategy for the-Niger Delta. DRAFT REPORT on Niger Delta Wetlands Volume II. World Bank, Washington DC. May 25th. 14.Iyoha, M. A. (2009). The environmental effects of oil industry activities on the Nigerian economy: A Theoretical Analysis. Paper presented at the National conference on the Management of @ IJTSRD | Available Online @ www.ijtsrd.com | Volume – 2 | Issue – 5 | Jul-Aug 2018 Page: 464