Download
1 / 6
60 likes | 68 Views
Many of us are interested in detecting the irregularity in very small region of a transient signal which cannot be detected by necked eyes. That can be possible by discretizing the region in which the irregularity lie. There are two ways to discretize the signal. In theory one can use Fourier transform on the signal and cut in M pieces. Where as in practice discretization can be obtained by applying multiple number of filters Filter Bank .This paper will give knowledge of wavelets and filter banks and later on connection between them. These are rapidly developing topics in real time. The technique of filter banks for discrete signals and wavelets to represent functions are used throughout signal and image processing for compression, denoising, enhancement, motion estimation and pattern recognition. New wavelets continue to be constructed for new applications. To understand this process we need to have a brief knowledge about the basic concepts like Fourier Transform, Short Time Fourier Transform, Wavelet Transform, MRA, Filter and Filter bank Pinal Choksi "Elementary Theory of Wavelets and Filter Bank" Published in International Journal of Trend in Scientific Research and Development (ijtsrd), ISSN: 2456-6470, Volume-2 | Issue-4 , June 2018, URL: https://www.ijtsrd.com/papers/ijtsrd12997.pdf Paper URL: http://www.ijtsrd.com/mathemetics/applied-mathematics/12997/elementary-theory-of-wavelets-and-filter-bank/pinal-choksi<br>

E N D
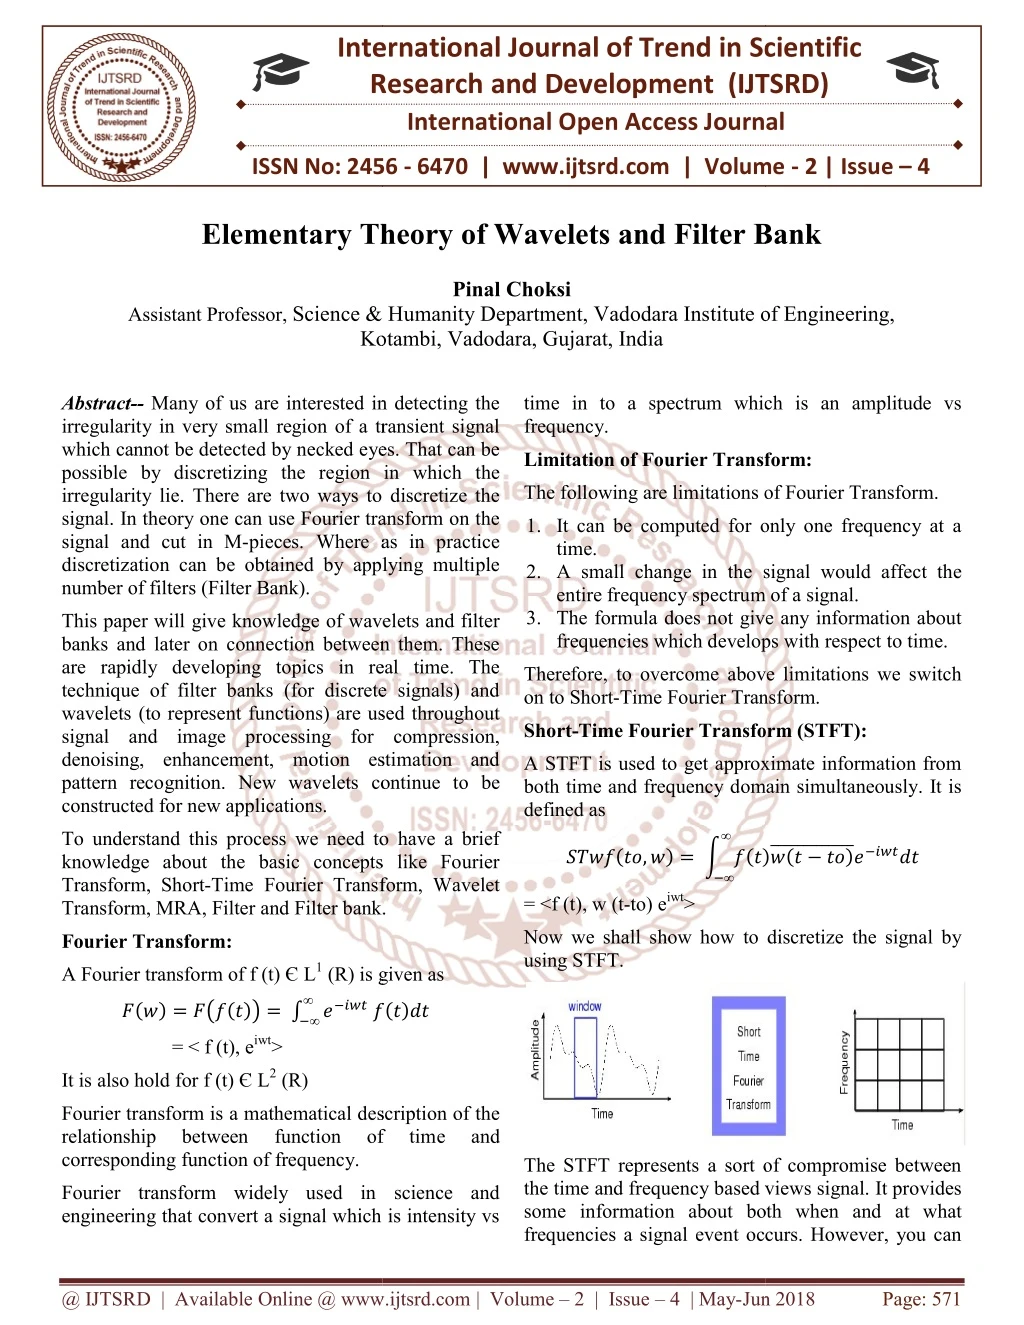
International Research Research and Development (IJTSRD) International Open Access Journal Elementary Theory of Wavelets and Filter Bank Elementary Theory of Wavelets and Filter Bank International Journal of Trend in Scientific Scientific (IJTSRD) International Open Access Journal ISSN No: 2456 ISSN No: 2456 - 6470 | www.ijtsrd.com | Volume 6470 | www.ijtsrd.com | Volume - 2 | Issue – 4 Elementary Theory of Wavelets and Filter Bank Pinal Choksi Assistant Professor, Science & Humanity Department, Vadodara Institute of Engineering, Kotambi Science & Humanity Department, Vadodara Institute of Engineering, Science & Humanity Department, Vadodara Institute of Engineering, Kotambi, Vadodara, Gujarat, India Abstract--Many of us are interested in detecting the irregularity in very small region of a transient signal which cannot be detected by necked eyes. That can be possible by discretizing the region in which the irregularity lie. There are two ways to discretize the signal. In theory one can use Fourier transform on the signal and cut in M-pieces. Where as in practice discretization can be obtained by applying multiple number of filters (Filter Bank). Many of us are interested in detecting the y in very small region of a transient signal which cannot be detected by necked eyes. That can be possible by discretizing the region in which the irregularity lie. There are two ways to discretize the signal. In theory one can use Fourier transform on the pieces. Where as in practice discretization can be obtained by applying multiple time in to a spectrum which is an amplitude vs time in to a spectrum which is an amplitude vs frequency. Limitation of Fourier Transform: Limitation of Fourier Transform: The following are limitations of Fourier Transform. itations of Fourier Transform. 1.It can be computed for only one frequency at a time. 2.A small change in the signal would affect the entire frequency spectrum of a signal. 3.The formula does not give any information about frequencies which develops with respect frequencies which develops with respect to time. It can be computed for only one frequency at a A small change in the signal would affect the entire frequency spectrum of a signal. The formula does not give any information about This paper will give knowledge of wavelets and filter banks and later on connection between them. These are rapidly developing topics in real time. The technique of filter banks (for discrete signals) and wavelets (to represent functions) are used throughout signal and image processing for compression, denoising, enhancement, motion estimation and pattern recognition. New wavelets continue to be constructed for new applications. This paper will give knowledge of wavelets and filter banks and later on connection between them. These oping topics in real time. The technique of filter banks (for discrete signals) and wavelets (to represent functions) are used throughout signal and image processing for compression, denoising, enhancement, motion estimation and Therefore, to overcome above limitations we switch Therefore, to overcome above limitations we switch on to Short-Time Fourier Transform. Time Fourier Transform. Short-Time Fourier Transform (STFT): Time Fourier Transform (STFT): A STFT is used to get approximate information from both time and frequency domain simultaneously. It is A STFT is used to get approximate information from both time and frequency domain simultaneously. It is defined as velets continue to be To understand this process we need to have a brief knowledge about the basic concepts like Fourier Transform, Short-Time Fourier Transform, Wavelet Transform, MRA, Filter and Filter bank. Transform, MRA, Filter and Filter bank. To understand this process we need to have a brief knowledge about the basic concepts like Fourier Time Fourier Transform, Wavelet ∞ ( )?(? − ??) ???????????????????? ????(??,?) = ? ?(?) ?∞ = <f (t), w (t-to) eiwt> Now we shall show how to discretize the signal by Now we shall show how to discretize the signal by using STFT. Fourier Transform: A Fourier transform of f (t) Є L1 (R) is given as (R) is given as ∞ ?∞ ????? ? ?(?)?? ?(?) = ???(?)? = ∫ = < f (t), eiwt> It is also hold for f (t) Є L2 (R) Fourier transform is a mathematical description of the relationship between function corresponding function of frequency. Fourier transform is a mathematical description of the relationship between function of of tim time and The STFT represents a sort of compromise between the time and frequency based views signal. It provides some information about both when and at what frequencies a signal event occurs. However, you can frequencies a signal event occurs. However, you can The STFT represents a sort of compromise between the time and frequency based views signal. It provides formation about both when and at what Fourier transform widely used in science and engineering that convert a signal which is intensity vs engineering that convert a signal which is intensity vs Fourier transform widely used in science and @ IJTSRD | Available Online @ www.ijtsrd.com @ IJTSRD | Available Online @ www.ijtsrd.com | Volume – 2 | Issue – 4 | May-Jun 2018 Jun 2018 Page: 571
International Journal of Trend in Scientific Re International Journal of Trend in Scientific Research and Development (IJTSRD) ISSN: 2456 search and Development (IJTSRD) ISSN: 2456-6470 only obtain this information with limited precision, and that is determined by the size of the window. and that is determined by the size of the window. only obtain this information with limited precision, Limitation of STFT: The limitation is that once you choose a pa size for the time window, that window is the same for all frequencies. Many signals require a more flexible approach one where we can vary the window size to determine more accurately either time or frequency, but that is possible in wavelet transform. The limitation is that once you choose a particular size for the time window, that window is the same for all frequencies. Many signals require a more flexible approach one where we can vary the window size to determine more accurately either time or frequency, A plot of the Fourier coefficients of this signal shows nothing particularly interesting; a flat spectrum with two peaks representing a signal frequency. However, a plot of wavelet coefficients clearly shows the exact A plot of the Fourier coefficients of this signal shows nothing particularly interesting; a flat spectrum with two peaks representing a signal frequency. However, a plot of wavelet coefficients clearly shows the exa location in time of the discontinuity. location in time of the discontinuity. form. Wavelet: History of wavelet is in 1983, Jean Morlet a French Geophysicist working in the oil company first introduce the concept of a wavelet. He developed a new time frequency analysis calling “Wavelets of constant shape.” History of wavelet is in 1983, Jean Morlet a French Geophysicist working in the oil company first introduce the concept of a wavelet. He developed a new time frequency analysis calling “Wavelets of In 1984, Grossman and Morlet said the mathematical foundation for the wavelet transform using the tools like Hilbert space, frame etc. et said the mathematical foundation for the wavelet transform using the tools In 1986 Daubechies, Grossman, Meyer developed the theory regarding wavelets. This was the beginning of the wavelet or rather golden era of developm wavelet concept. In 1986 Daubechies, Grossman, Meyer developed the theory regarding wavelets. This was the beginning of the wavelet or rather golden era of development of Wavelet analysis is capable of revealing aspects of data that other signal analysis techniques aspects like trends, breakdown points, discontinuities in higher similarity. Furthermore because it affords a different view of data than those presented by traditional techniques, wavelet analysis can often noise a signal without appreciable Wavelet analysis is capable of revealing aspects of data that other signal analysis techniques aspects like trends, breakdown points, discontinuities in higher derivatives and self-similarity. Furthermore because affords a different view of data than those presented by traditional techniques, wavelet analysis can often compress or de-noise a signal without appreciable degradation. We all are interested in knowing what wavelet is. How it is useful. Basically small waves are called wavelets. We all are interested in knowing what wavelet is. How it is useful. Basically small waves are called Wavelet has small concentrated burst of finite energy in the time domain (this condition makes the wavelet little) and it exhibits some oscillation in time (this conditions makes wavelet wavy), hence the word wavelet. Wavelet has small concentrated burst of finite energy in the time domain (this condition makes the wavelet exhibits some oscillation in time (this conditions makes wavelet wavy), hence the word Indeed, in their brief history within the signal processing field, wavelets have already proven themselves to be an indispensable addition to the analyst’s collection of tools. Hence it is very popular Indeed, in their brief history within the signal processing field, wavelets have themselves to be an indispensable addition to the analyst’s collection of tools. Hence it is very popular in field of analysis. Thus, wavelets have oscillatory behavior in some interval and then decays rapidly to zero, outside the interval. Thus, wavelets have oscillatory behavior in some interval and then decays rapidly to zero, outside the One major advantage afforded by wavelets is th ability to perform local analysis that is, to analyze a localized area of a larger signal. One major advantage afforded by wavelets is the ability to perform local analysis that is, to analyze a Equate wavelets with sine waves, which are the basis of Fourier analysis. Sinusoids do not have limited duration they extend from minus to plus infinity. And where sinusoids are smooth and predictable, wavelets tend to be irregular and asymmetric. tend to be irregular and asymmetric. Equate wavelets with sine waves, which are the basis of Fourier analysis. Sinusoids do not have limited they extend from minus to plus infinity. And where sinusoids are smooth and predictable, wavelets Consider discontinuity one so tiny as to be barely visible. Such a signal easily could be generated in the real world, perhaps by a power fluctuation or a noisy switch. a power fluctuation or a noisy switch. Consider discontinuity one so tiny as to be barely visible. Such a signal easily could be generated in the real world, a a sinusoidal sinusoidal signal signal with with a a small small Fourier analysis consists of breaking up a signal into sine waves of various frequencies. Similarly, wavelet analysis is the breaking up of a signal into shifted and scaled versions of the original (or mother) wavelet. scaled versions of the original (or mother) wavelet. Fourier analysis consists of breaking up a signal into sine waves of various frequencies. Similarly, wavelet s the breaking up of a signal into shifted and @ IJTSRD | Available Online @ www.ijtsrd.com @ IJTSRD | Available Online @ www.ijtsrd.com | Volume – 2 | Issue – 4 | May-Jun 2018 Jun 2018 Page: 572
International Journal of Trend in Scientific Re International Journal of Trend in Scientific Research and Development (IJTSRD) ISSN: 2456 search and Development (IJTSRD) ISSN: 2456-6470 As in above image of sine waves and wavelets, seen that intuitively that signals with sharp changes might be better analyzed with an irregular wavelet than a smooth sinusoid, just as some foods are better handled with a fork than a spoon. As in above image of sine waves and wavelets, seen that intuitively that signals with sharp changes might be better analyzed with an irregular wavelet than with a smooth sinusoid, just as some foods are better Scaling a wavelet simply means stretching (or compressing) it. To go beyond colloquial descriptions such as “stretching” that is introduce the scale factor, Scaling a wavelet simply means stretching (or compressing) it. To go beyond colloquial descriptions such as “stretching” that is introduce the scale factor, often denoted by the letter ᵅ. In sinusoids, the effect of the scale factor is very easy to the scale factor is very easy to see: . In sinusoids, the effect of Wavelet Transform: Wavelet transform represents a windowing technique with variable-sized regions. Wavelet transform allows the use of long time intervals where we want precise low-frequency information and shorter regions where we want high frequency information. where we want high frequency information. Wavelet transform represents a windowing technique sized regions. Wavelet transform allows the use of long time intervals where we want more frequency information and shorter regions The scale factor works exactly the same with wavelets. The smaller the scale factor, the more The scale factor works exactly the same with wavelets. The smaller the scale factor, the more “compressed” the wavelet. Here what this looks like in contrast with the time based, frequency-based and STFT views of a signal: based and STFT views of a signal: Here what this looks like in contrast with the time- As in above image noticed that wavelet transform does not use a time-frequency region, but rather s time-scale region. As in above image noticed that wavelet transform frequency region, but rather s It is clear from the diagrams that, for a sinusoidal sin is inversely propotional to the . Similarly, with wavelet analysis, the scale is inversely proportional to the frequency of It is clear from the diagrams that, for a sinusoidal sin (wt), the scale factor ᵅis inversely propotional to the radian frequency?. Similarly, with wavelet analysis, the scale is inversely proportional to the frequency of the signal. The Continuous Wavelet Transform (CWT): If ψ Є L2 (R) satisfies the “admissibility” condition (R) satisfies the “admissibility” condition The Continuous Wavelet Transform (CWT): ????????????????? ∞ ?∞ ?(?)????? Є L2 (R) ?? = ∫ ???? ;? ?? Shifting: =∫ Shifting a wavelet simply means delaying its onset. Mathematically, delaying a function f(t) by k is Shifting a wavelet simply means delaying its onset. Mathematically, delaying a function f(t) by k is represented by f(t-k). ∞ ?∞ ?(?)ψb,a (t) ??????????? = <f(t), ψ ?(???) ? ?|?| = <f(t), ψb,a (t) > Discrete Wavelet Transform: (DWT) let Transform: (DWT) where ψb,a (t) = The continuous wavelet transform has unique advantage as its widely width is control by scale ‘ɑ’. However computational load of continuous wavelet transform is very heavy in order to capture all characteristics. To minimize excess of computation in continuous wavelet transform mathematician has developed discrete wavelet transform which can be obtained from the process known as multi resolution The continuous wavelet transform has unique advantage as its widely width is control by scale ‘ However computational load of continuous wavelet transform is very heavy in order to capture all characteristics. To minimize excess of continuous wavelet transform mathematician has developed discrete wavelet transform which can be obtained from the process known as multi resolution analysis. Where a,bЄ R with a≠ 0 as parameter a,b gives effect of magnification or contraction and translation respectively. ψb,a (t) are called baby wavelets. Wavelets are very very small and having irregular behavior in very small interval. Therefore are covered under the curve is approximately zero. ∞ ?∞ ?(?) ?? ?ℎ? ????? ?? ???ℎ?? ???????. Where a,bЄ R with a≠ 0 as parameter a,b gives effect of magnification or contraction and translation (t) are called baby wavelets. Wavelets are very very small and having irregular behavior in very small interval. Therefore area covered under the curve is approximately zero. L2 i.e. (R) where ?(?)?? = 0 ; ? ? ∫ Multi Resolution Analysis: (MRA) Multi Resolution Analysis: (MRA) MRA decomposes space L2 (R) in a set of MRA decomposes space L approximate subspace {Vj} j ∈ Scaling: ∈ ? Wavelet analysis produces a time-scale view of a signal, and now what is exactly mean by signal, and now what is exactly mean by scale. scale view of a Vj = ……..⨁????⨁???? @ IJTSRD | Available Online @ www.ijtsrd.com @ IJTSRD | Available Online @ www.ijtsrd.com | Volume – 2 | Issue – 4 | May-Jun 2018 Jun 2018 Page: 573
International Journal of Trend in Scientific Research and Development (IJTSRD) ISSN: 2456-6470 = |H(eiw) |eiϕ(w) Where { Vj } is generated by some scaling function Φ ? (?) ??? {?? } is generated by some wavelet ? ? ?? (?) We can describe filter in three different way that is in time domain, z-domain and in term of linear algebra. Which satisfies the following axioms: Filter Bank: 1.{0} ⋯…….⊂ ??(?) sequence of subspaces Vj is nested. 2.⋂ ?? ?∈? = {0} 3.Close ⋃ ?? ?∈? = ??(?)i.e. closure of union of Vj gives whole of L2(R) 4.????= ??⨁?? 5.?(?) ∈ ?? ⇔ ?(2?) ∈ ???? , ?∈? 6.There exist a Φ(?)? ?? such that {Φ?,?} is an orthonormal basis that spans Vj. 7.F(x) ? ??⇔ ?(2?) ∈ ???? , ?∈? ⊂ ⋯…….??? ⊂ ??? ⊂ therefore, Suppose discrete or an analog signal ‘s’ which is limited with bandwidth Ω. We can write signal as the sum of M signals. Each of which have bandwidth Ω/M. In this way, a wide band signal can be split into M signals of smaller band and transmitted over a channel with smaller bandwidth. The receiver can reconstruct the original signal. In theory we can compute, Fourier transform of signal ‘s’, cut this in M pieces and back transform. In practice, we are applying M filters to the signal and each of these filters generates one signal with limited bandwidth. This is called M channel filter bank. the scaling function Now, suppose we are applying 5 filters to the signal and each of these filters generates one of the 5 signals with small bandwidth. This is called 5-channel filter bank. Filter: Filter is an operator which maps one signal to another signal. Filter has basically two properties. Now M=2 Linearity: Suppose a discrete signal‘s’. We can apply a low pass filter H and a high pass filter G. which splits the signal‘s’ in two parts. The part which contains the low frequencies which gives a low resolution idea of the signal and the other part which contains the high frequencies which gives the detail information. This is called 2-channel filter bank. It splits frequency band in two sub bands. If H is a filter? Operator. H ((?? + ??) = ??(?) + ??(?) Where ? ,? ??? ????????? ??? ?,? ??? ??? ????????? (?,? ∈ ?) Time invariant or Shift invariant: It is possible to stretch the half bands again to the full bandwidth by down-sampling. Down sampling means signals passing through filter in which we delete odd samples and keep only even number of samples. Down sampling is denoted by (↓) A filter H is called shift invariant or time invariant if it communicates with the shift operator HD = DH. This means that delaying the filtered signal is the same as filtering the delayed signal. When filter is operated on an impulse say ? then the effect generated is known as impulse response. The impulse response is given by filter coefficients. If s=sn is given signal. S’ = ↓ ? if sn ‘ = s2n In general, s’ = (↓ ? )s if sn‘ =snM (M is number of filters). h = (hn) = H ?…………..(1) The fourier transform of the impulse response is known as frequency response of the filter. H(eiw) = ∑ ℎ? ? ????????? ??? ?????? ? = ??? ) In z-domain, S’= ↓ ? ↔ ?′(??) = ?(?)?? (??) ? ????? ( ?? ????? ? − (by applying low pass filter & high pass filter G(z) = H(-z) ) But frequency response is the combination of amplitude and phase angle so, ↔ ?′(?) = ?(??/?) + ? (−??/?) 2 H(eiw) = ?∑ ℎ? ??????eiϕ(w) ? @ IJTSRD | Available Online @ www.ijtsrd.com | Volume – 2 | Issue – 4 | May-Jun 2018 Page: 574
International Journal of Trend in Scientific Research and Development (IJTSRD) ISSN: 2456-6470 Thus the operation in upper branch of the analysis part gives LP (z) as the result of multiplication with the adjoint of the matrix. ↔ ?′(?) = ?(??/?) + ?(−??/?) 2 In the frequency domain, ⎡. … … … ?′????? = ?(???/?) + ?(??? /?) ⎤ ℎ5 ? … … ℎ3 ? ℎ? ? … ℎ1 ? ℎ? ? ℎ? ? ℎ?? ? ℎ? ? ℎ?? … … … ⎢ ⎥ 2 ? ?= --------------(*) ⎢ ⎥ ⎢ ⎥ This shows that if bandwidth of S is π then band width of S’ is 2π. ⎢ ⎥ ⎣ ⎦ For the high pass band π/2 ≤ |?|< π we have to shift the spectrum first to low pass band Similarly, for the lower branch. Thus the vector p of the samples of LP (z) and the vector q of the samples of HP (z) are obtained from the samples s of S(z) as follows ?? ?∗ On the synthesis side, the up sampling followed by filtering with H means that we multiply with toeplitz matrix whose entries are the impulse response coefficients (i.e. the Fourier coefficients of H(z) ) and in which every other column is deleted. That is the matrix H which is defined like ?? but without the tildes. That is as follows |?|<π/2 which corresponds to adding π to w. This means that for the shifted spectrum. The frequency response is given by ? ??? = ?∗ ? ?? = ??∗ ? ?????? (???)= ?????? ????? = ?(−1)???????? On the analysis side of a two channel filter bank. We have the application of the two filters ? ∗ which are both followed by down sample operation. Here we use the notation ? ∗ transfer function of this filter is ? ∗ ? ? and ? ∗ ? to denote that the ?= ∑ ℎ??? ? ⎡: … ⎤ ℎ? … … ℎ? ℎ? … ℎ? ℎ? ℎ? … ℎ? ℎ? : ? to denote that transfer function of ?= ∑ ???? ? ? ∗ ?(?) is the transform of Similarly for ? ∗ this filter is ? ∗ the time reversed sequence h* where h = hk On the synthesis side, of the filter bank one finds the mirror image of the analysis side. ⎢ ⎥ … … ⎢ ⎥ H = … ⎢ ⎥ ⎢ ⎥ ⎣ …⎦ The matrix G can be defined similarly for the other branch on the synthesis side. First the signals are up sampled. This means that between every two samples a zero is introduced. This is denoted as The samples ?̂ of the result ?? (?) are then computed from the samples of LP (z) and HP (z) by ′ ′ ?′= ↑ ? ↔ ??? = 0 ↔ ?′(?) = ?? ??? ????? = ?(??) ?̂ = ??+ ?? = [H G]?? After the up sampling some filters H and G are applied and two result signals Y and X are added. The synthesis side should up to the analysis computing such that the resulting signal S’ is again equal to the original signal S. ?? ≡ ? ?? ?? ∗ We shall have ?̂ = ? ?? ?? ? = ? The operation of the filter bank can also be written in terms of (infinite) matrices. Filtering by low pass filter ? ∗ ? means multiplication with the infinite toeplitz matrix with entries the impulse response ℎ ∗ (ℎ ?-n) i.e. the Fourier coefficient of ? ∗ Down sampling means that we skip every other row (the odd ones). The recursive application of a two channel filter bank leads to an M channel filter bank. If the 2-channel filter banks split in equal band-widths then the bandwidths of the end channels will not be the same. ? = ?. Wavelet Decomposition and Reconstruction: Consider the general structure of multiresolution analysis and wavelets as in @ IJTSRD | Available Online @ www.ijtsrd.com | Volume – 2 | Issue – 4 | May-Jun 2018 Page: 575
International Journal of Trend in Scientific Research and Development (IJTSRD) ISSN: 2456-6470 Vj = ……..⨁????⨁???? , j∈ ? Φ(2x − 1) = ∑ [?????Φ (x − k) ? k]---- (10) + ?????φ(x − Where functionΦ ? ??(?) ??? {?? } is generated by some wavelet ? ? ?? (?). {Vj} is generated by scaling This two formulas (9) and (10) can combine into a single formula: Φ(2x − l) = ∑ [?????Φ (x − k) ? k], ?∈? ---- (11) + ?????φ(x − By third property of MRA we know every function f in ??(?) can be approximated closely as is desired by fN?VN , for some ? ? ? Which is called ‘decomposition relation’ of Φand φ. As, Vj = Vj-1⨁???? , for any j∈ ? Now two pairs sequences ({pk}, {qk}) and ({ak}, {bk}) all of which are unique due to direct sum relationship. V1 = V0⨁?? These sequences are used to formulate the following reconstruction and decomposition algorithm. Here {pk} and {qk} are called reconstruction sequences, while {ak} and {bk} are called decomposition sequences. fN has a unique decomposition fN = fN-1 ⨁???? where ???? ? ???? ??? ???? ? ???? by repeating this process, we have ??= ????+ ????+ ⋯+ ????+ ???? --------------- ---- (6) Where ????? ??? ????? and M is so chosen that ???? is sufficiently “blurred”. The decomposition in (6) is unique is called “wavelet decomposition” ; and the “blur” is measured in terms of the variation( or frequency or number of cycles per unit length) of ????. A less efficient “stopping criterion” is to require ‖????‖ to be smaller than some threshold. Now an algorithm approach for expressing ?? as a direct sum of its components ????,????,…,???? and ???? and recovering ?? from these components Since both the scaling function Φ? V0 and the wavelet ? ? ?? are in V1 and since V1 is generated by Φ?,?(?) = 2 There exists two sequences {pk} and {qk}∈ ?? such that CONCLUSION The computational scheme to compute wavelet transform can be derived directly from the polyphase matrix; it can be applied in much more general situation than classical wavelet filter banks. Therefore, we introduce it via an alternative approach to wavelets (subdivision schemes) which will give a framework in which it is easier to consider more general situations. lifting scheme which is an efficient The signal is split into a low pass and a band pass part by the filters ? ? and ? ?respectively. This corresponds to computing the VN and the WN part of a signal in VN+1. The results are then sub sampled, to remove redundancy. Next a (primal) lifting step is executed with the filter. At the synthesis side the same operations are undone in opposite order to obtain original signal. ? ?Φ(2x − k);? ∈ ? Φ(x) = ∑ ??Φ (2x − k) ? ----------------- (7) References [1]Charles K. Chui: An introduction to wavelets: MRA, Wavelet Reconstructions. Academic Press San Diego New York Boston 1992 [2]Anthony Teolis: Computational Signal Processing with Wavelets: what is wavelet? Printed and bound by Hamilton printing New York. [3]Adhemar Bultheel: Wavelets with applications in signal and image processing: Filters and Filter Bank. [4]Richard R. Goldberg: Fourier Transform: The Fourier Transform on L.Cambridge at the University ?(?) = ∑ ??Φ (2x − k) ? For all x ∈ ? ----------------- (8) Decompositions and The formulas (7) and (8) are called the “two scale relation “ of the scaling function and wavelet respectively. Since both Φ(2x) and Φ(2x − 1) are in V1 and V1 = V0⨁?? There are four l2 sequences which are denoted by {a- 2k},{b-2k},{a1-2k},{b1-2k}, ? ∈ ? Such that Φ(2x) = ∑ [????Φ (x − k) + ????φ(x − k)] ? ----- (9) -------- Press 1970. @ IJTSRD | Available Online @ www.ijtsrd.com | Volume – 2 | Issue – 4 | May-Jun 2018 Page: 576