Download
1 / 5
50 likes | 53 Views
Wireless Sensor Networks WSNs is a strong candidate for smart grid applications, such as advanced metering infrastructure, demand response management, dynamic pricing, load control, electricity fraud detection, fault diagnostics, substation monitoring and control as well as automation of various elements of the power grid. The realization of these applications directly depends on efficiency of communication facilities among power grid elements. However, the harsh power grid environmental conditions with obstacles, noise, interference, and fading pose great challenges to reliability of these facilities to monitor and control the power grid. The purpose of this paper is to evaluate performance of WSNs in different power grid environments such as 500 kv substations, main power control room, and underground network transformer vaults. The power grid environments are modeled using a log normal shadowing path loss model channel with realistic parameters. The network is simulated and performance is evaluated using packet delivery ratio, communication delay, and energy consumption. The simulation results have revealed that different environments have considerable impacts on performance of WSNs which make it suitable for most applications that need low data rate with low reliability requirements. Ms. Khushboo Yadav | Prof. Mahesh Sharma "Performance Analysis of Wireless Sensor Network in Smart Grid Environment" Published in International Journal of Trend in Scientific Research and Development (ijtsrd), ISSN: 2456-6470, Volume-3 | Issue-5 , August 2019, URL: https://www.ijtsrd.com/papers/ijtsrd26607.pdf Paper URL: https://www.ijtsrd.com/engineering/electronics-and-communication-engineering/26607/performance-analysis-of-wireless-sensor-network-in-smart-grid-environment/ms-khushboo-yadav<br>

E N D
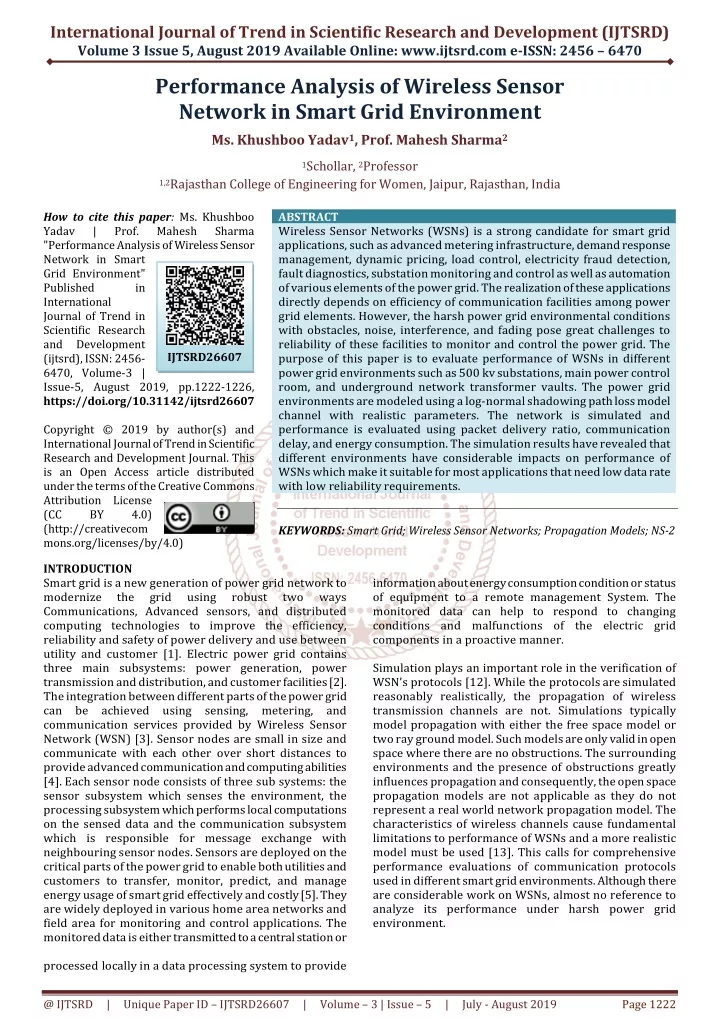
International Journal of Trend in Scientific Research and Development (IJTSRD) Volume 3 Issue 5, August 2019 Available Online: www.ijtsrd.com e-ISSN: 2456 – 6470 Performance Analysis of Wireless Sensor Network in Smart Grid Environment Ms. Khushboo Yadav1, Prof. Mahesh Sharma2 1Schollar, 2Professor 1,2Rajasthan College of Engineering for Women, Jaipur, Rajasthan, India How to cite this paper: Ms. Khushboo Yadav | Prof. "Performance Analysis of Wireless Sensor Network in Smart Grid Environment" Published in International Journal of Trend in Scientific Research and Development (ijtsrd), ISSN: 2456- 6470, Volume-3 | Issue-5, August 2019, pp.1222-1226, https://doi.org/10.31142/ijtsrd26607 Copyright © 2019 by author(s) and International Journal of Trend in Scientific Research and Development Journal. This is an Open Access article distributed under the terms of the Creative Commons Attribution License (CC BY 4.0) (http://creativecom mons.org/licenses/by/4.0) INTRODUCTION Smart grid is a new generation of power grid network to modernize the grid using Communications, Advanced sensors, and distributed computing technologies to improve the efficiency, reliability and safety of power delivery and use between utility and customer [1]. Electric power grid contains three main subsystems: power generation, power transmission and distribution, and customer facilities [2]. The integration between different parts of the power grid can be achieved using sensing, metering, and communication services provided by Wireless Sensor Network (WSN) [3]. Sensor nodes are small in size and communicate with each other over short distances to provide advanced communication and computing abilities [4]. Each sensor node consists of three sub systems: the sensor subsystem which senses the environment, the processing subsystem which performs local computations on the sensed data and the communication subsystem which is responsible for message exchange with neighbouring sensor nodes. Sensors are deployed on the critical parts of the power grid to enable both utilities and customers to transfer, monitor, predict, and manage energy usage of smart grid effectively and costly [5]. They are widely deployed in various home area networks and field area for monitoring and control applications. The monitored data is either transmitted to a central station or processed locally in a data processing system to provide ABSTRACT Wireless Sensor Networks (WSNs) is a strong candidate for smart grid applications, such as advanced metering infrastructure, demand response management, dynamic pricing, load control, electricity fraud detection, fault diagnostics, substation monitoring and control as well as automation of various elements of the power grid. The realization of these applications directly depends on efficiency of communication facilities among power grid elements. However, the harsh power grid environmental conditions with obstacles, noise, interference, and fading pose great challenges to reliability of these facilities to monitor and control the power grid. The purpose of this paper is to evaluate performance of WSNs in different power grid environments such as 500 kv substations, main power control room, and underground network transformer vaults. The power grid environments are modeled using a log-normal shadowing path loss model channel with realistic parameters. The network is simulated and performance is evaluated using packet delivery ratio, communication delay, and energy consumption. The simulation results have revealed that different environments have considerable impacts on performance of WSNs which make it suitable for most applications that need low data rate with low reliability requirements. KEYWORDS: Smart Grid; Wireless Sensor Networks; Propagation Models; NS-2 information about energy consumption condition or status of equipment to a remote management System. The monitored data can help to respond to changing conditions and malfunctions of the electric grid components in a proactive manner. Simulation plays an important role in the verification of WSN’s protocols [12]. While the protocols are simulated reasonably realistically, the propagation of wireless transmission channels are not. Simulations typically model propagation with either the free space model or two ray ground model. Such models are only valid in open space where there are no obstructions. The surrounding environments and the presence of obstructions greatly influences propagation and consequently, the open space propagation models are not applicable as they do not represent a real world network propagation model. The characteristics of wireless channels cause fundamental limitations to performance of WSNs and a more realistic model must be used [13]. This calls for comprehensive performance evaluations of communication protocols used in different smart grid environments. Although there are considerable work on WSNs, almost no reference to analyze its performance under harsh power grid environment. Mahesh Sharma IJTSRD26607 robust two ways @ IJTSRD | Unique Paper ID – IJTSRD26607 | Volume – 3 | Issue – 5 | July - August 2019 Page 1222
International Journal of Trend in Scientific Research and Development (IJTSRD) @ www.ijtsrd.com eISSN: 2456-6470 nature of propagation channel depends on direct line sight, multipath, presence of obstacles, reflection, scattering, shadowing etc. The received signal is composed of multipath signals with randomly distributed amplitudes and phases, combined to give a resultant signal that varies in time and space [20]. Proper modelling of the power gird environment is needed for proper evaluation of performance of communication facilities in this environments. Wireless Sensor Networks The physical and MAC layers of WSNs are based on IEEE802.15.4 standard [7]. In this type of networks, three types of devices are defined: a coordinator, routers, and end devices. A coordinator is responsible for establishing, maintaining, and controlling all the neighbour devices on the network. It allocates network addresses to other nodes which join the network successively. Routers, which are sometimes called relay nodes, take care of data transmission and have capability to extend the scope of network. End devices collect data and transmit then to routers or coordinators. In addition, network usually contain one or several gateways for communicating with other networks. The coordinator or any of the routers can serve as a gateway [14]. The MAC layer can operate in beacon or non-beacon modes [15]. In beacon enabled mode, the coordinator node will periodically send out a beacon with detailed information about the network and possibly guaranteed time slots for certain nodes using slotted Carrier Sense Multiple Access with Collision Avoidance (CSMA/CA) protocol, along with a super frame structure that is managed by the coordinator. The non beacon enabled mode uses unslotted CSMA-CA as the MAC protocol. In electrical power grid, the quality of the wireless channel is a complex combination of effects due to path loss, and multipath fading. Path loss quantifies the loss in signal strength due to the distance and the absorption of the objects between two nodes. Shadow fading characterizes the fluctuations around the average path loss. In this model, the distance between transmitter and receiver is not the only variable parameter during simulations. To introduce random events, the shadowing model utilizes a random variable X. It requires a reference distance dO to calculate the average received free space signal strengthPr,FS(dO). The path loss exponent þ in equation (1) depends on the environment and it is constant. Values vary between two (free space) and six (indoor, non-line-of-sight). X is normal distributed with an average of zero and a standard deviation σ (called shadow deviation). Again it is non-variable and reasonable values vary between three (factory, line of sight) and twelve (outside of buildings). Values for þ and σ are usually empirically determined. Communication Challenges of Smart Grid Environments WSNs is responsible for identifying, establishing and maintaining routes between transmitter and receiver and facilitating communication when the nodes can no more communicate. Thus, how WSN’s perform in the given environment depends on how well it can identify between a good link and bad link during active communication [16]. Fading causes alternating constructive and destructive signal interference at the receiving node. As a result, there is no direct line of sight path and multiple propagated signals are received. This affect the received signal strength, which become the superimposition of direct signal as well as reflected, scattered and diffracted signals [17]. Consequently, the received signal will have a wide varying amplitude and phase, which causes multiple copies that interfere with each other. The interference of two or more multipath signals arriving at the receiver at slightly different times causes multipath fading [18]. This fluctuation in received signal strength may give misleading information about the received signal strength and this could affect performance of the routing protocols in two ways. First, receiver makes a false assumption that the link is no longer usable when it is still usable. This forces the routing protocol to start a new route search resulting into increased consumption of network resources, bandwidth and the battery power of the processing nodes. Second, the receiver assumes a bad link to be a good one and includes it in its route. Thus, during the data transmission, the link fails causing increased network activities through route recovery or additional route discoveries as will be indicated in the paper’s results. Pr,SH (d) = Pr,FS (do) |do|–β.10x X(x) = [x (– , ) | P (x) = N (0, 2)} (1) where Pr,SH(d) is the average received power, Pr,FS(dO) is average received free space signal strength at a reference distance dO corresponding to a point located in the far field of the transmit antenna, β is the path loss exponent, Xo is the zero mean Gaussian random variable with standard deviation σ. The values of the path loss exponent of the propagation environment β and the shadowing deviation σ were calculated from the measured data in electric power system environments, using square error of the regression analysis such that the difference between the measured and estimated path losses is minimized in a mean square error sense over a wide range of measurement locations and transmitter receiver separations. In real smart grid propagation environments, the received signal levels depend on the existence of line of sight (LOS), or the absence of it on the contrary (NLOS). Meanwhile in LOS scenarios the level of direct signal is higher compared to the rest of multipath versions of the propagated signal, in NLOS scenarios there is not a signal component which prevails in terms of amplitude over the rest of them. Six environments correspond to a 500 kV substation (LOS), a 500 kV substation (NLOS), an underground transformer vault (UTV) (LOS), an underground transformer vault (NLOS), a main power room (MPR) (LOS) and a main power room (NLOS). The seventh environment represents a non-smart grid environment. The log normal shadowing model is used for modelling the wireless links of various power grid environments radio propagation parameters for these different environments are summarized in Table 1[1]. Electrical Power Grid Environments The realization of smart grid depends on the communication capabilities of WSNs in harsh and complex electric power grid environments. The environmental noise and interference from nonlinear electric power equipment and fading in harsh smart grid environments, makes reliable challenging task for WSNs for smart grid applications. The electric power communication a @ IJTSRD | Unique Paper ID – IJTSRD26607 | Volume – 3 | Issue – 5 | July - August 2019 Page 1223
International Journal of Trend in Scientific Research and Development (IJTSRD) @ www.ijtsrd.com eISSN: 2456-6470 transmission, mainly due to link failures and CSMA/CA channel access mechanism. It is an important metric which can be used as an indicator to a congested network. Communication delay is the average time to receive all data on the destination side. It is the sum of delays at all links within the end- to-end path including processing delay, queuing delay, transmission delay, propagation delay and retransmission delay. Energy consumption is the average percentage of the consumed energy in network measured in Joules. The common simulation parameters are presented in Table 2. The simulations are conducted in seven scenarios in electric power grid environments. The log normal shadowing model is used based on experimentally determined log normal channel parameters for different smart grid environments. Six scenarios correspond to environments of a 500 kV substation (LOS), a 500 kV substation (NLOS), an underground transformer vault (LOS),an underground transformer vault (NLOS), a main power room (LOS) and a main power room (NLOS). The seventh scenario represents the non smart grid environment. Simulation Environment To investigate the effects of harsh smart grid environments on performance of WSNs, a network consisting of 15 sensor nodes is simulated on Network Simulator (NS-2) [21]. These nodes are configured in a star topology over an area of 50x50 square meter area. The star topology is used between the nodes and the coordinator to simulate application scenarios where sensor nodes reporting monitoring data to a central base station or gateway. The traffic is Constant Bit Rate (CBR) that is used to generate eight traffic flows. Each CBR connection started at random period of time. Once a CBR connection started, it continued generating packet till the end of the simulation. The packet generation rate varies from 1 packet per second to 5 packets per second. Each simulation was tested for an arbitrary 100 seconds simulation time. To statistically analyze performance, 10 runs are used to measure the average values of three performance metrics: communication delay and energy consumption. The packet delivery ratio is the ratio between the number of successful packets and the total number of transmitted packets. Packet loss may occur at any stage of a network packet delivery ratio, Table 1: Log Normal Shadowing Channel Parameters Propagation Environment 500–kv substation (LOS) outdoor 500–kv substation (NLOS) Outdoor Underground network transformer vault (LOS) Underground network transformer vault (NLOS) Main power room (NLOS) Indoor Main power room (NLOS) Indoor Non smart grid environment Indoor environment 500–kv substation (LOS) Outdoor 500–kv substation (NLOS) Outdoor Underground network transformer vault (LOS) Underground network transformer vault (NLOS) Main power room (LOS) Main power room (NLOS) Indoor Non smart grid environment Indoor environment Shadowing deviation 3.12 2.95 2.54 3.19 3.29 2.25 4 3.12 2.95 2.54 3.19 3.29 2.25 4 Path Loss β 2.42 3.51 1.45 3.15 1.64 2.38 1.4 2.42 3.51 1.45 3.14 1.64 2.38 1.4 Simulation Results Figure 1 shows the packet delivery ratio in different smart grid environments as a function of data rates. At lower data rates, packet delivery ratio is 92% because of legitimate packets loss. As higher data rate is applied to the network, more and more packets are dropped due to collisions and bad link quality in harsh smart grid environments. The signal attenuation caused by obstacles in NLOS environment have lowered the packet delivery ratio. Packets have to wait for longer period of time due to unsuccessful packet receptions causing delivery ratio to decrease and consequently to increase communication delay in Figure 2. At lower data rates, the MPR environment has lower delivery ratio compared to the UTV and 500 kV environments because higher value of path loss exponent which cause higher signal attenuation and lower the probability of receiving packets. As data rates increases, the MPR-NLOS gives the lowest delivery ratio because packets are dropped due to collisions and bad link quality. This would increase the number of retransmissions, effectively congesting the network even further. The inconsistent values at data rate of 4 packets per second for MPR- NLOS and 500 kv-LOS are due to link quality variations of wireless links in harsh power grid environments. The non smart grid environment gives the highest delivery ratio. Figure 2 shows the communication delay as a function of data rates. As data rate increases, the communication delay increases because of high packet loss, congestion and wireless channel characteristics in harsh smart grid environments. The non smart grid environment produced highest delay compared with six smart grid environments at data rate of 3 packets / second. At lower data rates, the NLOS environments exhibit less delay than the LOS environments which have higher number of retransmissions. At higher data rates, UTV environment shows better delay than 500 kv and MPR environments. @ IJTSRD | Unique Paper ID – IJTSRD26607 | Volume – 3 | Issue – 5 | July - August 2019 Page 1224
International Journal of Trend in Scientific Research and Development (IJTSRD) @ www.ijtsrd.com eISSN: 2456-6470 Table 2: Common Simulation Parameters Simulation Parameter Network topology Simulation Time Number of nodes Packet length Packer Type Propagation Model Queue Type Number of traffic flows MAC Protocol Terrain Size Data Rate Value Star 100 Seconds 15 70 bytes Constant bit rate Shadowing Model Drop tail 8 IEEE802.15.4 50 x 50m2 1–5 Packets/second Figure 1: Packet Delivery Ratio versus Data Rates Figure 2: Communication Delay versus Data Rates Figure 3: Energy Consumption versus Data Rates @ IJTSRD | Unique Paper ID – IJTSRD26607 | Volume – 3 | Issue – 5 | July - August 2019 Page 1225
International Journal of Trend in Scientific Research and Development (IJTSRD) @ www.ijtsrd.com eISSN: 2456-6470 Figure 3 shows the energy consumed in different smart grid environments as a function of data rates. At lower data rate, the energy consumption decreases with the increase of data rate, because of direct proportionality of the energy consumption and packet delivery ratio in Figure 1. The sudden drop in energy consumption for data rate of 3Pkts/sec is attributed to the high increase in delay in Figure 2 due to network congestion. At higher data rates, energy consumption increases because of retransmissions due high packet loss, congestion and wireless channel characteristics in harsh smart grid environments. The energy consumption of NLOS environments is relatively higher than the LOS environments because of high number of retransmissions and packet drop of the harsh NLOS environments. At lower data rates, the MPR environment has consumed less energy compared to the 500 kV and UTV environments. At higher data rates, the 500kv-NLOS consumed the highest energy. References [1]S. Bi, C. K. Ho & R. Zhang, (08 April 2015) "Wireless powered communication: challenges," IEEE Communications Magazine, Vol. 53, Issue: 4, pp. 117 - 125, DOI: 10.1109/ MCOM.2015.7081084. Issue: 1, pp. 1872 - 1899, DOI: 10.1145/ 1464420.1464425. [5]B. Rashid & H. Rehmani, (January 2016) "Applications of wireless sensor networks for urban areas: A survey," Journal of Network and Computer Applications, Vol. 60, pp. 192-219, https://doi.org/ 10.1016/j.jnca.2015.09.008. [6]H. S. Savitha, K. S. Divya, Abhilasha, Chandhini & S. Manasa, (May 2017) "Industrial Wireless Sensor Networks: Challenges, Design Principles, and Technical Approaches," International Journal of Engineering Research Communication Engineering (IJERECE), pp. 215-221, ISSN (Online) 2394-6849. in Electronics and [7]L. L. Nassef, (December 2010) "On the Effects of Fading and Mobility in On Demand Routing Protocols," Egyptian Informatics Journal, Vol. 11, Issue 2, pp. 67-74, http://dx.doi.org/ 10.1016/ j.eij.2010.10.003. [8]P. Sharma & G. Pandove, (May-June 2017) "A Review Article on Wireless Sensor Network in Smart Grid," International Journal of Advanced Research in Computer Science, Vol. 8, No. 5, pp. 1903- 1907, ISSN No. 0976-5697. opportunities and [2]A. Leonardi, K. Mathioudakis, A. Wiesmaier & F. Zeiger, (2014) "Towards the Smart Grid: Substation Automation Architecture Hindawi Publishing Corporation, Vol. 2014, Article ID http://dx.doi.org/10.1155/2014/896296. [9]S. Jabbar, M. A. Habib, A. A. Minhas, M. Ahmad, R. Ashraf, S. Khalid & K. Han, (18 February 2018) "Analysis of Factors Affecting Energy Aware Routing in Wireless Sensor Communications and Mobile Computing- Hindawi, Vol. 2018, Article ID 9087269, pp. 396-405, https://doi.org/10.1155/2018/9087269. and Technologies," Network," Wireless 896296, [3]M. Erol-Kantarci & H. Mouftah, (17 March 2011) "Wireless Sensor Networks for Cost-Efficient Residential Energy Management in the Smart Grid," IEEE Transactions on Smart Grid, Vol. 2, Issue: 2, pp. 314 - 325, DOI: 10.1109/ TSG. 2011.2114678. [10]S. Jabbar, M. Asif Habib, A. Minhas, M. Ahmad, R. Ashraf, S. Khalid & K. Han, (2018) "Analysis of Factors Affecting Energy Aware Routing in Wireless Sensor Network," Communications and Mobile Computing, Vol. 2018, Article ID 9087269, https://doi.org/ 10.1155/ 2018/9087269. Hindawi, Wireless [4]I. Dietrich & F. Dressler, (February 2009) "On the lifetime of wireless sensor networks," ACM Transactions on Sensor Networks (TOSN), Vol. 5 @ IJTSRD | Unique Paper ID – IJTSRD26607 | Volume – 3 | Issue – 5 | July - August 2019 Page 1226