Download
1 / 9
90 likes | 99 Views
The objective of this research was to examine the connection between cash flow and the financial performance of Ghana Stock Exchange GSE listed non financial companies. In particular, the research sought to identify the affiliation between cash flow and finanical performance of companies as measured by Return on Assets ROA examine the connection between cash flow and financial performance of companies as measured by Return on Equity ROE and create a association between cash flow and financial performance of companies as measured by Earnings Per Share EPS . The research was quantitative because it aimed at classifying characteristics, quantifying them in terms of numbers and creating a statistical model for testing hypothesis and explaining observations. The research was specifically correlated in nature as it attempted to investigate the bivariate connections between cash flow and the financial performance of the companies. The research was lastly a nature panel because, at distinct points in time, it attempted to collect data on the same study units. Secondary panel data from 15 non finanical institutions were sampled for the study. For the research, both the descriptive and inferential data analysis methods were used. The mean, standard deviation, variance, minimum and maximum values, skew and kurtosis of the factors of the study were analyzed in the descriptive data analysis method, while the Pearson Product Moment Correlation Coefficient information analysis method was used to identify the bivariate connections between cash flow and financial performance of the companies. All information assessment was performed using STATA version 15 statistical software package at an alpha a rate of 5 percent p= 0.05 . cash flow had an insignificent negative association with the firms financial performance of the companies as measured by ROA from the correlation estimates of the study. But an insignificantly positive connection was also discovered between cash flow and the ROE but EPS of the companies had an insignificant negative link with the financial performance of the companies. Based on the results, the research suggested that, as an rise in cash flow resulted in a reduction in the financial performance of the companies as measured by ROA, the officials of the sampled companies should take a lecture on the predictors of the cash flow of the companies as such predictors could directly impact the cash flow of the companies and then their final result. There is also a need for companies to improve their profitability in the elements of client base, net assets, sales volume and market share to boost their cash flow. Increasing the cash flow of the companies will not only increase them in terms of profitability, but will also help them achieve competitive advantage over others as bigger companies are anticipated to be more effective than their lower counterparts and have better funds to survive financial downturns. Takyi Hannah Nyamaa | Takyi Kwabena Nsiah | Wilson Elorm Pekyi | Raphael Amoakoh Addai "The Connection between Cash Flows and the Financial Performance of Non-Financial Firms: An Empirical Evidence from the Ghana Stock Exchange (GSE)" Published in International Journal of Trend in Scientific Research and Development (ijtsrd), ISSN: 2456-6470, Volume-3 | Issue-6 , October 2019, URL: https://www.ijtsrd.com/papers/ijtsrd28129.pdf Paper URL: https://www.ijtsrd.com/management/accounting-and-finance/28129/the-connection-between-cash-flows-and-the-financial-performance-of-non-financial-firms-an-empirical-evidence-from-the-ghana-stock-exchange-gse/takyi-hannah-nyamaa<br>

E N D
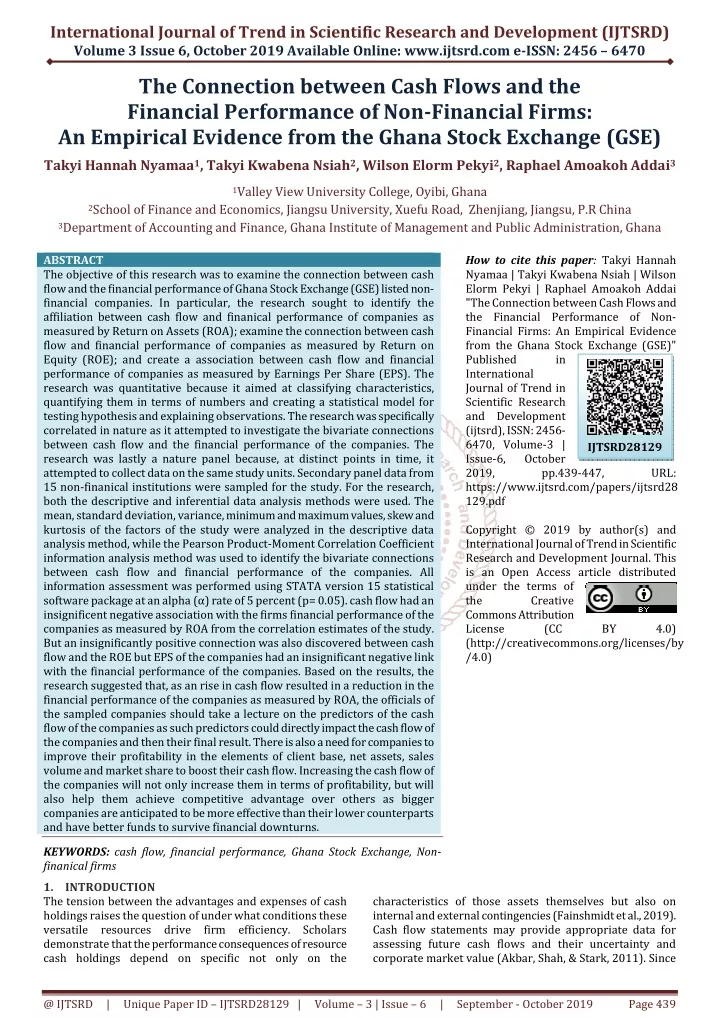
International Journal of Trend in Scientific Research and Development (IJTSRD) Volume 3 Issue 6, October 2019 Available Online: www.ijtsrd.com e-ISSN: 2456 – 6470 The Connection between Cash Flows and the Financial Performance of Non-Financial Firms: An Empirical Evidence from the Ghana Stock Exchange (GSE) Takyi Hannah Nyamaa1, Takyi Kwabena Nsiah2, Wilson Elorm Pekyi2, Raphael Amoakoh Addai3 1Valley View University College, Oyibi, Ghana 2School of Finance and Economics, Jiangsu University, Xuefu Road, Zhenjiang, Jiangsu, P.R China 3Department of Accounting and Finance, Ghana Institute of Management and Public Administration, Ghana ABSTRACT The objective of this research was to examine the connection between cash flow and the financial performance of Ghana Stock Exchange (GSE) listed non- financial companies. In particular, the research sought to identify the affiliation between cash flow and finanical performance of companies as measured by Return on Assets (ROA); examine the connection between cash flow and financial performance of companies as measured by Return on Equity (ROE); and create a association between cash flow and financial performance of companies as measured by Earnings Per Share (EPS). The research was quantitative because it aimed at classifying characteristics, quantifying them in terms of numbers and creating a statistical model for testing hypothesis and explaining observations. The research was specifically correlated in nature as it attempted to investigate the bivariate connections between cash flow and the financial performance of the companies. The research was lastly a nature panel because, at distinct points in time, it attempted to collect data on the same study units. Secondary panel data from 15 non-finanical institutions were sampled for the study. For the research, both the descriptive and inferential data analysis methods were used. The mean, standard deviation, variance, minimum and maximum values, skew and kurtosis of the factors of the study were analyzed in the descriptive data analysis method, while the Pearson Product-Moment Correlation Coefficient information analysis method was used to identify the bivariate connections between cash flow and financial performance of the companies. All information assessment was performed using STATA version 15 statistical software package at an alpha (α) rate of 5 percent (p= 0.05).cash flow had an insignificent negative association with the firms financial performance of the companies as measured by ROA from the correlation estimates of the study. But an insignificantly positive connection was also discovered between cash flow and the ROE but EPS of the companies had an insignificant negative link with the financial performance of the companies. Based on the results, the research suggested that, as an rise in cash flow resulted in a reduction in the financial performance of the companies as measured by ROA, the officials of the sampled companies should take a lecture on the predictors of the cash flow of the companies as such predictors could directly impact the cash flow of the companies and then their final result. There is also a need for companies to improve their profitability in the elements of client base, net assets, sales volume and market share to boost their cash flow. Increasing the cash flow of the companies will not only increase them in terms of profitability, but will also help them achieve competitive advantage over others as bigger companies are anticipated to be more effective than their lower counterparts and have better funds to survive financial downturns. KEYWORDS: cash flow, financial performance, Ghana Stock Exchange, Non- finanical firms 1.INTRODUCTION The tension between the advantages and expenses of cash holdings raises the question of under what conditions these versatile resources drive firm efficiency. Scholars demonstrate that the performance consequences of resource cash holdings depend on specific not only on the How to cite this paper:Takyi Hannah Nyamaa | Takyi Kwabena Nsiah | Wilson Elorm Pekyi | Raphael Amoakoh Addai "The Connection between Cash Flows and the Financial Performance of Non- Financial Firms: An Empirical Evidence from the Ghana Stock Exchange (GSE)" Published in International Journal of Trend in Scientific Research and Development (ijtsrd), ISSN: 2456- 6470, Volume-3 | Issue-6, October 2019, pp.439-447, https://www.ijtsrd.com/papers/ijtsrd28 129.pdf Copyright © 2019 by author(s) and International Journal of Trend in Scientific Research and Development Journal. This is an Open Access article distributed under the terms of the Creative Commons Attribution License (CC (http://creativecommons.org/licenses/by /4.0) IJTSRD28129 URL: BY 4.0) characteristics of those assets themselves but also on internal and external contingencies (Fainshmidt et al., 2019). Cash flow statements may provide appropriate data for assessing future cash flows and their uncertainty and corporate market value (Akbar, Shah, & Stark, 2011). Since @ IJTSRD | Unique Paper ID – IJTSRD28129 | Volume – 3 | Issue – 6 | September - October 2019 Page 439
International Journal of Trend in Scientific Research and Development (IJTSRD) @ www.ijtsrd.com eISSN: 2456-6470 cash flow is the lifeblood of a company, precise cash flow determination allows companies to create significant economic decisions relating to whether the company survives or fails. As a measure of profitability and economic health for companies. Cash flow could provide potential hints as to the capacity of the source to pay its short-term debts and therefore attract prospective investors. The statement of cash flow has three parts: cash flow from operating activities, cash flow from investing activities and cash flow from financing activities. This helps users of financial statements of companies (stakeholders) to know the cash circulating of the firm and to predict firm performance. Empirical reviews have shown that cash flow has a link with the company’s financial performance. In Malaysia, Mukthar (2014) studied the link between free cash flows and some Malaysian listed companies ' dividend payouts. The research employed panel data from 100 listed companies on Bursa Malaysia. A statistically significant positive link between free cash flows and the dividend payouts of the companies has been formed from the outcomes of the study. As Chris (2019) points out, favorable cash flows show that a company's liquid assets are rising, allowing it to settle debts, reinvest in its company, return money to investors, pay costs and provide a buffer against future economic difficulties. Yazan, Aminul and Tunku (2017) explored the influence of cash flows on the performance of companies listed on the Amman Stock Exchange's share prices. Cash flows had a significant positive effect on the performance of the share prices of the companies from the study. In Nigeria, Nwanyanwu (2015) performed a survey on cash flow and efficiency from the Nigerian hospitality and print media industries of 45 small and medium-sized enterprises. The research revealed a considerably positive association between the cash flow situation and the net profit of the companies by adopting Pearson's Product Moment Correlation Coefficient information analysis method. These studies indicate that as cash flow increases the financial performance of the companies also increases and vice versa. However, in other studies in Jordan, the impact of cash flow management on the economic performance of insurance companies in Jordan was examined by Nimer and Munther (2017). Data from 23 insurance companies ' annual reports for the period 2009 to 2013 were used for the study. Operating and investment cash flows had a significantly negative association with the financial performance of the companies. Similarly, In Iran, the association between various income and cash flow measures of firm performance and stock returns was explored by Ali, Alireze, and Jalal (2013). Data were used for the research for the period 2003 to 2011. A significantly negative connection between cash flows and the performance of companies was found through the simple multiple regression analysis. It can be concluded from the aforementioned research that cash flow research and the connection with the financial performance of companies have not been carried out in a more extensive way. This is proved by the shortage of a specific study that attempted to examine the connection between cash flow and financial performance of the Ghana Stock Exchange (GSE) listed non-financial companies. Therefore, the researchers considered it timely and essential to conduct this research in order to help fill the gap. Most of the study subjects focused on the cash flow and firm financial performance in a developed economy, but also in Ghana and Africa few studies have been done. However, the literature demonstrates that mostly cash flow is used as a control variable in firms’ measurement but this study employed it as themain dependent variable to test its significance on the financial performance of firms. The researchers see it fit that this study will help fill the gap. This study is organized into different parts; section 1 present the introduction, section 2 review the empirical literature on cash flow and its association with financial performance, section 3 consist of how data was collected and analyzed, section 4 is on data analysis and results in discussion and finally, section 5 gives the conclusion and recommendations. 1.1.OBJECTIVE OF THE STUDY. The aim of this research was to investigate the link between size and firm’s performance of the Ghana Stock Exchange (GSE) listed non-financial companies. The results of the study are expected to add to the current pool of literature on the connection between the size and financial performance of companies. The research would thus serve as reference material for learners and potential scientists who might want to fill the gaps recognized in this research. In particular, the research attempted to: 1.Examine the association between cash flows and the firms’ financial performance as measured by ROA. 2.Explore the connection between cash flows and the firms’ financial performance as measured by ROE. 3.Find out the affiliation between cash flows and the firms’ financial performance as measured by EPS. 1.2.THE STUDY HYPOTHESIS Without testing some assumptions, the goal of this research could not be accomplished. Therefore, the following hypothesis was developed for testing on the basis of the study's particular goals: H01 : Cash flow has no significant relationship with the firms’ financial performance as measured by ROA. H02 : Cash flow has no significant association with the firms’ financial performance as measured by ROE. H03 : Cash flow has no significant affiliation with the firms’ financial performance as measured by EPS. 2.EMPIRICAL REVIEWS Wang (2010) investigated the effect of free money flow on the financial performance of 505 companies listed on the Taiwan Stock Market from 2002 to 2007. Free cash flow had a statistically significant impact on the economic results of companies from the regression analysis of the study. But the findings were contradictory. On the one side, higher free money flow escalated uncontrolled spending that reduced economic efficiency as a result. Free cash flow, on the other side, had a positive association with the firm’s financial performance of the companies as it was produced as a consequence of operational leadership effectiveness. By studying cash flows from operating, investment and funding operations. Ibrahim and Ahmad (2015) reviewed the effect of cash flows on Jordanian commercial banks ' share rates. Data from 12 listed business banks ' annual reports were used for the research. Cash flows from operations, financial performance @ IJTSRD | Unique Paper ID – IJTSRD28129 | Volume – 3 | Issue – 6 | September - October 2019 Page 440
International Journal of Trend in Scientific Research and Development (IJTSRD) @ www.ijtsrd.com eISSN: 2456-6470 investment and funding activities had a negative connection with the share cost of the banks from the results of the study. In Taiwan, Yensen, Paoyu Pinhui and Yulu (2018), the impact of multiple cash flows on company value was explored through the use of censored data panel models on chosen Taiwanese companies. Their findings suggest that companies raising resources for capital budgeting projects can increase their firm value, leading to cash inflows from funding operations and cash outflows to investment operations. The study results further examined that company value could not be improved if cash inflows from operations arising from sales increased due to reduced profit margin or purchases decreased due to declining market share. Elaine, Ahmed, Ooi, and Tong (2017) researched the impact of free cash flow on Malaysia's corporate performance. The research used panel information for the period 2008 to 2012. Free cash flow had a significant reverse impact on the economic performance of the companies as measured by ROA and Tobin's Q from the regression assessment of the study. James and Andrew (2013) study the link between cash flow management and economic peformance in manufacturing. Their experiments were based on; examining the relationships between changes in cash flow policies and changes in firm financial performance using a longitudinal sample of firm information, and investigating the direction of the relationship between quarterly changes in cash flow positions and firm financial performance. Data were analyzed using the Generalized Estimating Equations (GEE) methodology to evaluate the eight-quarters longitudinal sample of cash flow and financial performance information from 1233 manufacturing companies listed on U.S. inventory exchanges. Their analyzes stated that changes in the frequently used Cash Conversion Cycle (CCC) measure were not associated with changes in firm performance; however, changes in the less-used Operating Cash Cycle (OCC) metric were discovered to be associated significantly with variations in Tobin's q. Tonny, Moeljadi, Atim, and Kusuma (2016) examined the effect of firm-specific factors; free money flows, leverage and interest rates on stock returns as an intermediate variable. The research employed data from 51 firms listed on the Indonesian stock exchange between 2009 and 2013. An insignificant impact of free money flows on the stock returns of the companies was created from the results of the study. In Kenya, Mutende, Mwangi, Njihia, and Ochieng (2017) examined the moderating position of company structures in the connection between free cash flows and the financial performance of Nairobi companies. The research specifically sought to investigate the connection between free cash flows and the economic performance of companies and to examine the impact of company features on the relationship between free cash flows and the economic performance of companies. For the study, panel data was used for the period 2006 to 2015. A statistically significant connection between free money flows and the financial performance of the companies has been formed from the results of the study. Kamran, Zhao, and Ambreen (2017) reviewed the effect of cash flow on the profitability of companies listed on the Karachi Stock Exchange. For the period ranging from 2010 t0 2014. Free cash flow had a statistically significant positive association with the profitability of the companies from the results of the study. Muhammad and Aminatu (2018) reviewed the impact of operating cash flow on the financial performance of five (5) conglomerate companies listed in Nigeria. For the study, secondary data from the annual reports and accounts of the firms for the period ranging from 2005 to 2014 were used. Using descriptive, correlational and panel data regression analyses, the study found that operating cash flow had an insignificantly positive impact on the financial performance of companies as measured by ROA. In Jordan, Yazan, Aminul, and Tunku (2017) researched the impact of cash flows on the results of companies listed on the Amman Stock Exchange's share prices. Cash flows had a significant impact on the performance of the share prices of the companies from the results of the study. Gheshlaghi, Ahamdzadeh, and Faal (2014) reviewed the component impacts of the cash flow statement on leadership outcomes in 138 companies listed on the Tehran Stock Exchange between 2008-2012. Cash flows from operational operations and funding operations had an insignificant connection with the economic performance of the firm from the outcomes of the study. In Iran, the connection between multiple income and cash flow measures of firm performance and stock returns was researched by Ali, Alireze, and Jalal (2013). Data were used for the research for the period 2003 to 2011. A significantly negative connection between cash flows and the performance of companies was found through the simple multiple regression analysis. Novianti (2012) performed a survey on the impact on the Indonesian Stock Exchange of modifications in cash flow elements and accounting revenues on stock returns of certain listed manufacturing companies. For the research, sixty-four (64) listed production firms were used, chosen by the judgmental sampling technique. Operating cash flows did not have a significant impact on the stock returns of the companies from the multiple regression output of the study. Muhammad, Zheng, and Sadaf (2017) investigated the impact of free money flow on the profitability of the Karachi Stock Exchange (KSE) listed companies. For the research, data collected from 580 listed companies ' annual reports for the period 2010 to 2014 was used. As measured by ROCE, free cash flow had a significantly positive effect on the profitability of the companies from the regression analysis of the study. Sadaf and Junaid (2016) looked at the impact of free cash flows on the profitability of the Karachi Stock Exchange's 30 companies. The study employed data for the period 2010 to 2014. The findings of the study have shown that free cash flow has a significantly positive impact on the profitability of the firms. Ogbeide and Akanji (2018) looked at the link between cash flows and insurance companies ' financial performance in Nigeria. The study employed time-series data from twenty-seven (27) insurance companies listed for the period 2009 to 2014. Cash flows had a significant influence on the economic performance of the companies through the OLS regression assessment. Ebben and Johnson (2011) performed a comparable U.S. survey of 833 information from small U.S. retail and manufacturing companies ' annual financial statements. Using a regression assessment, their research findings show that a longer money preservation cycle (CCC) is positively related to Invested Capital and negatively linked with Asset Turnover, ROI, and Net Balance Position. In Ghana, Securities Exchange-listed @ IJTSRD | Unique Paper ID – IJTSRD28129 | Volume – 3 | Issue – 6 | September - October 2019 Page 441
International Journal of Trend in Scientific Research and Development (IJTSRD) @ www.ijtsrd.com eISSN: 2456-6470 Mohammed and Yusheng (2019) study the connection between cash flow and the firm’s financial performance of companies listed on the Ghana Stock Exchange for the with data from fifteen (15). Their finding indicated that Cash flows had a statistically significant positive connection with the firm’s performance of the companies as measured by ROA. An insignificantly positive association was also suggested between cash flows and the ROE and ROCE of the companies. From the Pearson Product-Moment Correlation Coefficient output of their study. 2.1.CONCEPTUAL MODEL The researhers developed three financial performance proxies as measurements. Return on Assets (ROA), Return on Equity (ROE), and Earnings Per Share (EPS)against the cash flow ratio. The research embraced data analysis descriptive and inferential methods. All variables of the study were analyzed using the mean, standard deviation, variance, minimum and maximum values, range, skewness, and kurtosis descriptive statistics. Since the study was a correlational study, the Pearson Product-Moment Correlation Coefficient or Pearson's Correlation Coefficient technique of data analysis, developed by Karl Pearson, was employed to measure the strength and direction of the linear relationship that existed between cash flow and the firms' financial performance. All information analyzes were performed using STATA version 15 software with a significant level of 5 percent (p<0.05). Table. Summary of varaibels of study Variables Definition Measurement Proxy Net Return on assets Financial performance ROA inome/total assets Income before interest and tax/ total equity Net income /total outstanding shares Net operating cash flow/total current liabilities RETURN ON ASSETS (ROA) Return on equity Financial performance ROE FINANCIAL PERFORMANCE EARNINGS PER SHARE (EPS) CASH FLOW (CFR) Earnings per share Financial performace 3.RESEARCH METHODOLOGY The methodology chapter of a study answers questions according to Denscombe (2014): how was the information gathered? And, how has the information been analyzed? This study was quantitative research. The research was quantitative because it aimed at classifying characteristics, quantifying them in terms of numbers and creating a statistical model for testing hypotheses and explaining observations. In the context of the developing country, Ghana, the relationship between cash flow and a company's performance has not been explained. We chose the non- financial sector as it contributes strongly to economic growth through financial efficiency. To date, Ghana Stock Exchange has listed twenty-eight non-financial firms. In order to deliver the most updated, meaningful and reliable results, we gathered the information over a period of 2010– 2017 for eight (8) years. This number represented 36.59% of the total number of listed firms or 53.57% of the total number of non-financial companies. A purposive sampling technique was to use to achieve this purpose. Companies with unaudited accounts, different currency other than the Ghana cedi, and suspended companies were excluded. In this research, we tried to empirically examine the association between cash flow and financial performance of non-financial companies operating in Ghana. The study's dependent variable is the performance of non-financial companies. We used three proxy variables, which were also used in most research, to evaluate the firm’s efficiency; return on asset, return on equity and earning per share. Since this research aimed at investigating the connection between the choice on the cash flow and the performance of non-financial companies, variable cash flow is taken as independent variables. EPS RETURN ON EQUITY (ROE) Cash flow ratio CFR Cash flow 4.RESULTS AND DISCUSSIONS 4.1.Test for Data Normality Table 1: Shapiro-Wilk Test for Data Normality Variable W V Z Prob(Z) ROA 0.22817 74.271 9.651 0.00000 ROE 0.36087 61.502 9.228 0.00000 EPS 0.37213 60.418 9.189 0.00000 CFR 0.30773 66.615 9.407 0.00000 To test the normality of the data, the Shapiro-Wilk normality test was introduced. It is a normality test with the null assumption in frequentist statistics that a sample X1..... Xn originated from a usually distributed population (Shapiro & Wilk, 1965). Thus, the ShapiroWilk test's null assumption is that usually the population is distributed. In other words, if the p-value is lower than the alpha level selected, then the null hypothesis is rejected and there is proof that the information being tested does not come from a normally distributed population. On the other side, if the p-value is higher than the alpha level selected, then it is not possible to reject the null hypothesis that the data tested came from a normally distributed population (Razali & Wah, 2011). For this research, the alpha level selected was 5% (α=0.05). The Shapiro-Wilk test therefore tested the null assumption that all ROA, ROE, and CFR data values were not usually distributed at the significant stage of 5%. As shown in Table 2, ROA had a 0.22817 W-test ratio, a 74.271 V-value, a 9.651 Z-value, and a 0.00000 p-value. At a significant level of 5 @ IJTSRD | Unique Paper ID – IJTSRD28129 | Volume – 3 | Issue – 6 | September - October 2019 Page 442
International Journal of Trend in Scientific Research and Development (IJTSRD) @ www.ijtsrd.com eISSN: 2456-6470 percent (p<0.05), the test was statistically significant. The research therefore rejected the null hypothesis that all ROA data values were usually distributed and adopted the alternative hypothesis that not all ROA data values were usually distributed at a significant level of 5 percent. The ROE data values, which had a W-test coefficient of 0.36087, a V-value of 61.502, a Z-value of 9.228 and a p-value of 0.00000, which means that the test was significant at the confidence interval of 95 percent. The study therefore rejected the null hypothesis that all ROE data values were normally distributed and accepted the alternative hypothesis that all ROE data values were not normally distributed at the statistically significant level of 5%. Similarly, the W-test for EPS of 0.30773, with a V-value of 68.615, a Z-value of 9.407 and a p-value of 0.00000, shows that the test was significant at α= 5%. Therefore, the study rejected the null hypothesis that all EPS data values were normally distributed and accepted the alternative hypothesis that not all EPS data values were normally distributed at the confidence interval of 95%. Finally, the CFR normality test at a 5% significant level resulted in a W-vale of 0.30773, a V-value of 68.615, a Z- value of 9.407, and a P-value of 0.00000. The null hypothesis that all the CFR values well normally distributed was rejected and the alternative hypothesis was accepted. A more generalized test was proposed for the study, since the data values of ROA, ROE,EPS, and CFR were not normally distributed through the Shapiro-Wilk Test. 4.2.Test for Heteroscedasticity Table 2: Bleusch-Pagan (1979) and Cook-Weisberg (1983) Test for Heteroscedasticity Variable Chi2 (1)-Value Prob. Value hypothesis that among the matched values of the models there was the presence of heteroscedasticity. As shown in Table 2, a hettest Chi2(1) of 0.38 for all the fitted values of the ROA working model was not statistically significant at the 5% significant level (p=0.5376). Therefore, the study accepted the null hypothesis that there was a lack of heteroscedasticity among the fitted values of the ROA working model and rejected the alternative hypothesis that there was a presence. Similarly, a higher Chi2(1) of 0.39 was statistically insignificant at α=5 percent (p=0.5304) for all equipped values of the ROE operating model. The research therefore recognized the null hypothesis that, among the selected values of the ROE working model, there was a lack of heteroscedasticity and dismissed the alternative hypothesis that among the selected values of the ROE operating model there heteroscedasticity. Therefore, the research recognized the null hypothesis that there was a lack of heteroscedasticity among the fitted values of the EPS working model and dismissed the alternative hypothesis that there was a presence of heteroscedasticity among the matched values of the EPS working model. 4.3.Test for Serial or Autocorrelation Autocorrelation is a mathematical depiction of the degree of resemblance across consecutive time phases between a specified time series and a lagged version of itself (Verbeek, 2012). Autocorrelation is consequential because its presence may lead to false hypothesis findings or tests. For this research, the Durbin Watson Test, which tests the null hypothesis that, in a model, the mistakes are serially uncorrelated (Durbin & Watson, 1950; Durbin & Watson, 1951; and Field, 2009). Table 3: Durbin-Watson Serial or Autocorrelation Test Result Variable Durbin-Watson d-statisti was the presence of ROA 0.32 0.2031 ROE 0.64 0.3308 EPS 0.40 0.2446 ROA 0.004905 As described by Giles (2013), if there are sub-populations with distinct variability from others, a collection of random variables is said to be heteroscedastic. According to Gujarati and Porter (2009), one of the assumptions of the Classical Linear Regression Model (CLRM) is that there is no heteroscedasticity; therefore, breaking this assumption means that the Gauss-Markov theorem does not apply, indicating that the estimators of the Ordinary Least Squares (OLS) are not the Best Linear Unbiased Estimators (BLUE) and that their variances are not the lowest of all other u. Heteroscedasticity allows an estimate of the value (and therefore normal mistakes) of the coefficients to be biased, potentially above or below the real or population variance. Therefore, the findings of the hypothesis may be incorrect (Ginker & Lieberman, 2017). In addition, the testing of hypotheses (t-test, F-test) becomes invalid due to the inconsistency in the covariance matrix of the estimated regression coefficients. The heteroscedasticity test of Bleusch-Pagan (1979) and Cook-Weisberg (1983) was used for this research. The test screened the null hypothesis that all the selected values of the ROCE, ROA and ROIC working designs had no heteroscedasticity at the 5 percent stage of importance, as opposed to the alternative ROE 2.081317 EPS 1.782185 The d-statistic findings of the Durbin-Watson study for the ROA, ROE, AND EPS modelS were 0.004905, 2.081317, and 1.782185 respectively. Therefore, the research did not acknowledge the null hypothesises that the mistakes were serially uncorrelated and found that in the residuals of the ROA, ROE, and EPS models there were first order adverse autocorrelations. 4.4.Model Specification and Estimation The research introduced the Robust Ordinary Least Squares (OLS) regression estimator as it was considered to be the most appropriate estimator for all ROA, ROE and EPS working model values. The estimator was considered more appropriate for the research because it had the characteristics to remedy the information abnormality and serial correlation problems identified in the diagnostic trials conducted by the research. The estimator was also considered more suitable as it supplied far better estimates of the regression coefficient than the regression estimator for OLS. @ IJTSRD | Unique Paper ID – IJTSRD28129 | Volume – 3 | Issue – 6 | September - October 2019 Page 443
International Journal of Trend in Scientific Research and Development (IJTSRD) @ www.ijtsrd.com eISSN: 2456-6470 4.5.Descriptive Analysis Table 4: Descriptive Statistics on ROA, ROE, EPS and CFR Variable ROA Mean -0.0545926 0.7775083 Standard deviation 0.2174258 Variance 0.6045192 Minimum -0.8634271 -2.9678520 Maximum 0.5821906 Skewness -8.663389 Kurtosis 83.03686 Observation 120 ROE EPS CFR -7.742179 -4.68638 0.4053917 0.5751154 -3.637821 6.125610 -6.718533 68.8895 120 0.4071967 12.7217 1.312449 1.722521 -8.351252 4.236541 9.062249 93.39269 120 0.7583636 6.799332 71.6281 120 The descriptive statistis of table 4, indicate that the ROA had a means value of –0.0545926, standard deviation and variance values of 0.2174258 and 0.6045192 respectively. This means that ROA data values have not been spread too extensively from the mean. The firms' ROA had a maximum value of 0.5821906 and a minimum value of -0.8634271. With a coefficient of - 8.663389, the distribution for ROA was negatively skewed. This suggests that the normal distribution was skewed to the right. The ROA had an 83.03686 kurtosis values meaning the distribution was not of proper shape. Also, the ROE of the compnies had a mean value of 0.775083, standard deviation 1.312449 and variance of 1.722521. With a maximum and a minimum vaues of 0.7583636 and -2.9678520 respectively. ROE had a positive skewed value of 6.799332 meaning the normal distribution was skewed to the left. The EPS of the firms’ studies a mean value of -7.742179, standard deviation and variance values of -4.68638 and 0.4053917 respectively. Finally, the study shows an aveage cash flow (CFR) of 0.4071967, a standard deviation value of 12.7217 and variance 0.5751154 meaning the CFR value was widely dispersed from the means value. The skewed and kurtosis values of CFR were 9.062249 and 93.39269. 4.6.Correlational Analysis The coefficient of correlation is a metric that determines the degree to which two variables are associated with motion(Steven, 2018). The Pearson Product-Moment Correlation Data Analysis Coefficient technique was used to measure the connection between the cash flow and the financial performance of the firms as measured by ROA, ROE and EPS. There was a insignificant weak and negative relationship between CFR and ROA at the 5% level of significance[ r= -0.0169 , (p=0.8548)>0,05]. The adverse association between CFR and ROA means that a rise in CFR resulted in a reduction in ROA and vice versa. The degree of connection between CFR and ROA is demonstrated by the determination coefficient (r2= 0.00028). Table 5: Correlational Matrix for ROA, ROE, EPS and CFR Variable ROA ROE ROA 1.0000 0.0466 0.6134 0.0802 0.3841 0.4967 -0.0169 0.8548 0.5859 Also, an insignificantly and positve association was found between CFR and ROE at a confidence interval of 95 percent[ r= 0.0502, (p=0.5859)>0.05]. The relationship between CFR and ROE implies an increase in CFR results in a rise in ROE and a reduction in CFR will lead to a reduction in ROE. The weakness of the connection between CFR and ROE is backed by the determination coefficient (r2=0.00252) which indicates that 0.25% of the values are explained by ROA. The adverse link between CFR and EPS is an indication that a rise in CFR has resulted in a fall in EPS and vice versa(r=-0.0334, p=0.7173>0.05). The degree of connection between CFR and EPS can also be justified by the determination coefficient (r2= 0.11156), which suggests that EPS accounted for 11.156% of the differences in CFR and CFR explained 11.156% of the differences in EPS. 4.7.REGRESSION ANALYSIS According to the Necessary Condition Analysis (2018), regression analysis enables researchers to know how the typical value of the response variable changes when one of the predictor variables is diverse, while other factors are fixed. This part of the research provides outcomes and conversations on the impact of cash flow on the firm's financial performance as measured by proxies of ROA, ROE, and ESP. Table 6: Effect of Capital Structure on the firms’ Financial Performance (ROA) Variables Coef. (β) Robust Std. Err CFR -0.0546492 0.0930146 CONS -0.0227763 0.116225 R-squared: 0.9433 F-Statistic 121.64 AIC Prob (F) 0.5568 EPS CFR ROE 1.0000 0.0626 EPS 1.0000 0.0502 -0.0334 0.7173 CFR 1.0000 t-statistic -0.59 -0.20 -11.25418 -16.29196 Prob(z) 0.557 0.845 BIC @ IJTSRD | Unique Paper ID – IJTSRD28129 | Volume – 3 | Issue – 6 | September - October 2019 Page 444
International Journal of Trend in Scientific Research and Development (IJTSRD) @ www.ijtsrd.com eISSN: 2456-6470 As shown in Table 7, CFR had a insignificant reverse impact on ROA at the significant at α=5%[ absolute t= 0.59, (p=0.557) > 0.05]. The beta (β) value of -0.0546492 means a unit rise in CFR on average resulting in a reduction in ROA of -0.0546492 when all other variables were considered constant. The determination ratio (R2=0.9433) shows that the predictor variable accounted for 94.33 percent of the differences in ROA. Furthermore, the F-statistical value of 121.64 was not statistically significant at the confidence interval of 95 percent (p=0.557). Based on this, it can be concluded that 94.33 percent of the differences in ROA accounted for CFR. Table 7: Effect of Capital Structure on the firms’ Financial Performance (ROE) Variables Coef. (β) Robust Std. Err CFR 0.0871675 0.1603428 CONS 0.1666777 0.1729251 R-squared: 0.6654 F-Statistic 58.4896 AIC Prob (F) 0.58667 BIC Similarly, as shown in Table 7, CFR significantly positively affected ROE at the 95 percent confidence interval [absolute t=0.54, (p=0.587)>0.05].The beta (β)value of CFR was 0.0871675. As the coefficient carried a positive weight, it means, on the average, a unit increase in CFR, led to a 0.0871675 increase in ROE when all other factors were held constant.The coefficient of determination (R2 =0.6654) also shows that, 66.54 percent ofthe variations in ROE was accounted for byCFR. Further, the F- statistic value of 58.4896was statistically insignificant at α=5% (p=0.58667). Table 8: Effect of Capital Structure on the Firms’ Financial Performance (EPS) Variables Coef. (β) Robust Std. Err CFR - 0.0354841 .0770355 CONS 0.1150668 .0920777 R-squared: 0.9241 F-Statistic 76.3691 Prob (F) 0.64501 BIC Kenton, W. (2019). -1.658201 Finally, CFR was not significant and had a negative assoication with the financial performance of the company atα=5 percent . From Table 8[ absolute t=0.46, (p=0.645)>0.05]. The negative beta (β) value of -0.0354841 is an indication that a unit increase in CFR on average significantly decreased EPS by 0.0354841 when all other factors were considered constant. The determination coefficient (R2=0.9241) shows that 92.41% of the variances in EPS were attributed to the explanatory variable CFR. In other words, the influencing variableCFR accounted for 92.41 percent of the differences in EPS. In addition, at the confidence interval of 95 percent (p>0.05), the F-statistic value of 76.3691 was insignificant. Based on this, the research concludes that 92.41 percent of differences in EPS was considerably explained by CFR. The remaining 7.59% of EPS variances can be attributed to other factors or inherent variables that did not form part of the study. 5.DISCUSION AND TEST OF HYPOTHESIS This part of the study tests the association the exit between cash flow (CFR) and firms’ financial performance as measured bt the proxies of ROA, ROE, and EPS. Also, other literature that agrees or disagrees with our findings is presented. 5.1.The affiliation between cash flow and firms’ financial performance as measured by ROA. Testing hypothesis one : Cash flow has no significant relationship with the firms’ financial performance as measured by ROA. From the studies correlation analysis it indicated that there was an insignicficant negative relationship between cash flow and firms’ financial performance as measured by ROA. (r= -0.0169 (p=0.8548>0.05)). Therefore, the null hypothesis is accepted and the alternative hypothesis is rejected. The effect of operating cash flow on the economic performance of five (5) conglomerate firms listed in Nigeria was assessed by Muhammad and Aminatu (2018). Secondary data from the company's annual reports and accounts for the period between 2005 and 2014 were used for the research. The research discovered that operating cash flow had an insignificantly positive effect on the economic results of businesses as measured by ROA, using descriptive, correlation and panel information regression analyzes. Our findings are, however, do not agree with that of Kamran, t-statistic 0.54 0.96 -14.365891 -17.215879 Prob(z) 0.587 0.335 t-statistic -0.46 1.25 2.01563 Prob(z) 0.645 0.211 AIC Zhao, and Ambreen (2017), whose resrach on the Karachi Stock Exchange listed companies, established a considerably positive link between free cash flows and profitability of companies. 5.2.The connection between cash flow and firms financial performance as measured by ROE Testing of hypothesis two : Cash flow has no significant association with the firms’ financial performance as measured by ROE. The result of the Peason Product-Moment correlational analysis indicated that the was a positive but insignicant association between cash flow and the firm's financial performance at 95% confidence interval (r=0.0466, p=0.6134)). From the results of the analysis the study null hypothesis two that there is no significant connection between CFR and financial performance as measured by ROE is accepted. Therefore the null hypothesis is rejected. This supports the works of Tonny, Moeljadi, Atim, and Kusuma (2016)whose results indicated an insignificant but positive relation between firm-specific factors; free money flows, leverage and interest rates on stock returns as an intermediate variable. 5.3.The association between cash flow and firm financial performance as measured by EPS. Testing of hypothesis three: cash flow has no significant relationship with firm's financial performance as measured @ IJTSRD | Unique Paper ID – IJTSRD28129 | Volume – 3 | Issue – 6 | September - October 2019 Page 445
International Journal of Trend in Scientific Research and Development (IJTSRD) @ www.ijtsrd.com eISSN: 2456-6470 [7]Durbin, J., & Watson, G. S. (1950). Testing for serial correlation in least squares regression, I. Biometrika, 37(3- 4), 409-428. by EPS. The findings of this study show that there is a negative and insignificant relationship between cash flow and firm's financial p=0.7173>0.05). The researchers, therefore, accepted the null hypothesis and rejected the alternative hypothesis. 6.Conclusion This research aimed to investigate the influence of cash flow on the firms' financial performance of Ghana Stock Exchange (GSE) listed non-financial companies. In particular, the research attempted to examine the impact of the cash flow ratio on the financial performance of the companies as measured by ROA; to determine the impact of the cash ratio on the financial performance of the companies as measured by ROE; and to determine the impact of the cash flow ratio on the financial performance of the companies as measured by EPS. After conducting some diagnostic and specification studies to address the fundamental assumptions of the Classical Linear Regression Model (CLRM), the research found that the cash flow ratio had an insignificant adverse impact on the financial performance of the companies as measured by ROA[ r=-0.0169 (p=0.8548>0.05]. However, cash flow ratio had a positive but insignificant impact on the financial performance of the companies as measured by ROE (r=0.0466, p=0.6134>0.05). finally, It was also found that the cash flow ratio impact on the financial performance of the companies as measured (p=0.7173)<0.05]. Therefore, in their effort to optimize financial performance, the firms must adopt cash flow management. This could be achieved if companies lower the quantities they hold in money and concentrate more on investments so they could earn greater yields instead of tying them down in idle money. From the theory's view, the result of this research is in tandem with that of previous research by highlighting the impact of cash flow on the firm's financial performance of companies as measured by ROA, ROE, and EPS. Therefore, the companies should inculcate the results of this research in their choices in order to satisfy their operational and development requirements as well as their shareholders ' wishes. REFERENCE [1]Akbar, S., Shah, S. Z. A., & Stark, A. W. (2011). The value relevance of cash flows, current accruals, and non- current accruals in the UK. International Review of Financial Analysis, 20(5), 311-319. performance (r=-0.0334, [8]Ebben, J.J., Johnson, A.C., (2011). Cash conversion cycle management in small firms: relationships with liquidity, invested capital and firm performance. J. Small Bus. Entrepreneurship 24(3), 381-396. [9]Elaine, K. S. L., Ahmed, R. A. L., Ooi, C. K., & Tong, C. Q. (2017). The impact of free cash flow on firm performance: Evidence from Malaysia. 30th IBIMA Conference: 8-9 November 2017, Madrid, Spain. [10]Fainshmidt, S., Wenger, L., Pezeshkan, A., & Mallon, M. R. (2019). When do Dynamic Capabilities Lead to Competitive Advantage? The Importance of Strategic Fit. Journal of Management Studies, 56(4), 758-787. [11]Gheshlaghi, F. D. R., Ahmadzadeh, Y., & Faal, F. (2014). The cash flow statement’s component effect on management performance in firms enlisted in the Tehran Stock Exchange. UCT, Journal of Management and Accounting Studies, 2(1), 14-21. [12]Ginker, T., & Lieberman, O. (2017). Robustness of binary choice models to conditional heteroscedasticity. Economics Letters, 10.1016/j.econlet.2016.11.024. 150, 130134. DOI: by EPS[ r= -0.0334, [13]Gujarati, D. N., & Porter, D. C. (2009). Econometric modeling: Model specification and diagnostic testing. Basic econometrics (fifth ed.). New York: McGraw-Hill Irwin. pp. 467-522 [14]Ibrahim, M. K., & Ahmad, Z. S. (2015). The effect of cash flow on share price of the Jordanian commercial banks listed in Amman Stock Exchange. International Journal of Economics and Finance, 7(5), 109-115. [15]James R. Kroesa,n, Andrew S. Manikasb,2013). Cash flow management and manufacturing firm financial performance: A longitudinal perspective. Int.J. Production Economics 148(2014) 37-50. [16]Kamran, M. R., Zhao, Z., & Ambreen, S. (2017). Free cash flow impact on firm’s profitability: An empirical indication of firms listed in KSE, Pakistan. European Online Journal of Natural and Social Sciences, 6(1), 146-157. [17]Mohammed, M., & Yusheng, K. (2019). The affiliation between cash flow and the financial performance of Non-financial firms. Empirical Evidence from Ghana Stock Exchange (GSE). EPRA International Journal of Research and Development. Vol 4(4), 2455-7838. [2]Ali, M., Alireze, A., & Jalal, A. (2013). The association between various earnings and cash flow measures of firm performance and stock returns: Some Iranian Evidence. International Journal of Accounting and Financial Reporting, 3(1), 24-41. [18]Muhammad, L., & Aminatu, S. M. (2018). Operating cash flow and corporate financial performance of listed conglomerate companies in Nigeria. IOSR Journal of Humanities and Social Science (IOSRJHSS)23(2), Ver. 11, 01-11. [3]Breusch, T. S., & Pagan, A. R. (1979). A simple test for heteroskedasticity and random coefficient variation. Econometrica, 47 (5), 1287-1294. [4]Chris (2019). What is the cash flow statement? Retrieved from [19]Muhammad, R. K., Zheng, Z., & Sadaf, A. (2017). Free cash flow impact on firm’s profitability: An empirical indication of firms listed in KSE, Pakistan. European Online Journal of Natural and Social Sciences, 6(1), 146-157. [5]Cook, R. D., & Weisberg, S. (1983). Diagnostics for heteroskedasticity in regression. Biometrika 70(1), 110. [6]Denscombe, M. (2014). The good research guide: For small-scale social research projects (5th edition). Buckingham, UK: Open University Press [20]Mukhtar, N. H. B. (2014). Corporate Governance and Cash Flow As Determinants Of Dividend Payout. Unpublished M.Sc. Thesis Submitted to Othman Yeop @ IJTSRD | Unique Paper ID – IJTSRD28129 | Volume – 3 | Issue – 6 | September - October 2019 Page 446
International Journal of Trend in Scientific Research and Development (IJTSRD) @ www.ijtsrd.com eISSN: 2456-6470 [26]Sadaf, A., & Junaid, A. (2016). Impact of free cash flow on the profitability of firms listed in Karachi Stock Exchange. Euro-Asian Journal of Economics and Finance, 4(4), 113-122. Abdullah Graduate School of Business, Universiti Utara Malaysia. [21]Mutende, E. A., Mwangi, M., Njihia, J. M., & Ochieng, D. E. (2017). The moderating role of firm characteristics on the relationship between free cash flows and financial performance of firms listed at the Nairobi Securities Exchange. Journal of Finance and Investment Analysis, 6(4), 55-74. [27]Shapiro, S. S., & Wilk, M. B. (1965). An analysis of variance test for normality (complete samples). Biometrika, 52 (3-4), 591-611. [28]Tonny, S. M., Moeljadi, P., Atim, D., & Kusuma, R. (2016). Leverage, free cash flow, and interest rates influence of stock return and financial performance as intervening variables (Study on manufacturing industry listed in Indonesia Stock Exchange). International Journal of Business and Management Invention, 5(2), 28-30. [22]Nimer, A., & Munther, A. (2017). An empirical study of the relationship between cash flow management and financial performance of the Jordanian insurance companies. International Business Management, 11(3), 776-782. [23]Novianti, D. (2012). The influence of cash flow changing and profit accounting to stock return in manufacturing companies listed on the Indonesia stock exchange. Proceedings of the 13th Malaysia Indonesia Conference on Economics, Accounting. [29]Verbeek, M. (2012). A guide to modern econometrics (fourth ed.). Chichester: John Wiley. pp. 112-116. [30]Wang, G. Y. (2010). The impacts of free cash flows and agency costs on firm performance. Journal of Service Science and Management, 3, 408-418. Management and [24]Nwanyanwu, L. A. (2015). Cash flow and organizational performance in Nigeria: Hospitality and print media industries perspectives. European Journal of Business, Economics, and Accountancy, Vol. 3(3), 66-72. [31]Yazan, S. O., Aminul, I. Md., & Tunku, S. T. A. (2017). The effect of cash flows on the share price on the Amman Stock Exchange. American Based Research Journal, 6(7), 22-28. [25]Razali, N., & Wah, Y. B. (2011). Power comparisons of Shapiro-Wilk, Kolmogorov-Smirnov, Lilliefors and Anderson-Darling tests. Journal of Statistical Modeling and Analytics, 2(1), 21-33 [32]Yensen. N, Paoyu. H, Pinhui. C, and Yulu. L, (2018). Cash flow statements and firm value: Evidence from The Quarterly Review of Economics and Finance 1062- 9769(17) 30305-8. @ IJTSRD | Unique Paper ID – IJTSRD28129 | Volume – 3 | Issue – 6 | September - October 2019 Page 447