Download
1 / 5
50 likes | 52 Views
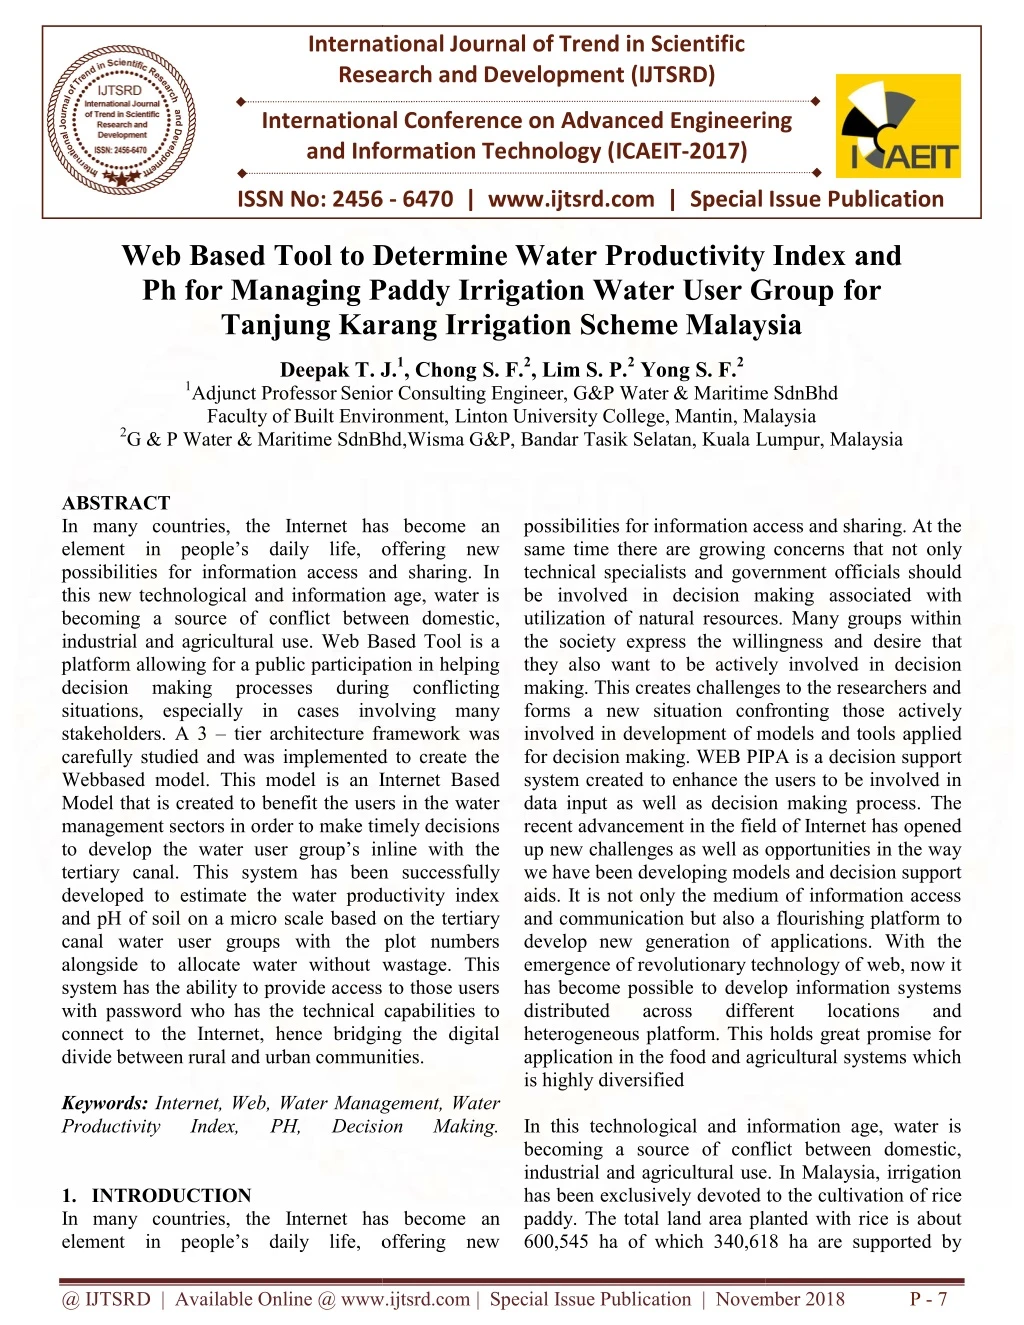
In many countries, the Internet has become an element in peoples daily life, offering new possibilities for information access and sharing. In this new technological and information age, water is becoming a source of conflict between domestic, industrial and agricultural use. Web Based Tool is a platform allowing for a public participation in helping decision making processes during conflicting situations, especially in cases involving many stakeholders. A 3 u201c tier architecture framework was carefully studied and was implemented to create the Webbased model. This model is an Internet Based Model that is created to benefit the users in the water management sectors in order to make timely decisions to develop the water user groups inline with the tertiary canal. This system has been successfully developed to estimate the water productivity index and pH of soil on a micro scale based on the tertiary canal water user groups with the plot numbers alongside to allocate water without wastage. This system has the ability to provide access to those users with password who has the technical capabilities to connect to the Internet, hence bridging the digital divide between rural and urban communities. Deepak T. J. | Chong S. F. | Lim S. P | Yong S. F. "Web Based Tool to Determine Water Productivity Index and Ph for Managing Paddy Irrigation Water User Group for Tanjung Karang Irrigation Scheme Malaysia" Published in International Journal of Trend in Scientific Research and Development (ijtsrd), ISSN: 2456-6470, Special Issue | International Conference on Advanced Engineering and Information Technology , November 2018, URL: https://www.ijtsrd.com/papers/ijtsrd19111.pdf Paper URL: https://www.ijtsrd.com/engineering/water-resource-engineering/19111/web-based-tool-to-determine-water-productivity-index-and--ph-for-managing-paddy-irrigation-water-user-group-for--tanjung-karang-irrigation-scheme-malaysia/deepak-t-j<br>

E N D
International Journal of Trend in Scientific Research and Development International Conference on Advanced Engineering and Information Technology (ICAEIT-2017) o Determine Water Productivity Index or Managing Paddy Irrigation Water User Group Tanjung Karang Irrigation Scheme Malaysia Tanjung Karang Irrigation Scheme Malaysia International Journal of Trend in Scientific Research and Development (IJTSRD) International Conference on Advanced Engineering and Information Technology ISSN No: 2456 - 6470 | www.ijtsrd.com | Special Issue International Conference on Advanced Engineering ISSN No: 2456 Special Issue Publication Web Based Tool to Determine Water Productivity Index Ph for Managing Paddy Irrigation Water User Group Tanjung Karang Irrigation Scheme Malaysia Deepak T. J. 1Adjunct ProfessorSenior Consulting Engineer, G&P Water & Maritime SdnBhd Faculty of Built Environment, 2G & P Water & Maritime SdnBhd G & P Water & Maritime SdnBhd,Wisma G&P, Bandar Tasik Selatan, Kuala Lumpur, Malaysia o Determine Water Productivity Index and or Managing Paddy Irrigation Water User Group for J.1, Chong S. F.2, Lim S. P.2 Yong S. F.2 Senior Consulting Engineer, G&P Water & Maritime SdnBhd Faculty of Built Environment, Linton University College, Mantin, Malaysia Linton University College, Mantin, Malaysia Senior Consulting Engineer, G&P Water & Maritime SdnBhd Lumpur, Malaysia ABSTRACT In many countries, the Internet has become an element in people’s daily life, offering new possibilities for information access and sharing. In this new technological and information age, water is becoming a source of conflict between domestic, industrial and agricultural use. Web Based Tool is a platform allowing for a public participation in helping decision making processes situations, especially in cases involving many stakeholders. A 3 – tier architecture framework was carefully studied and was implemented to create the Webbased model. This model is an Internet Based Model that is created to benefit the users in the water management sectors in order to make timely decisions to develop the water user group’s inline with the tertiary canal. This system has been successfully developed to estimate the water productivity index and pH of soil on a micro scale based on the tertiary canal water user groups with the plot numbers alongside to allocate water without wastage. This system has the ability to provide access to those users with password who has the technical capabilities to connect to the Internet, hence bridging the digital divide between rural and urban communities. Keywords: Internet, Web, Water Management, Water Productivity Index, PH, 1.INTRODUCTION In many countries, the Internet has become an element in people’s daily life, offering new element in people’s daily life, offering new possibilities for information access and sharing. At the same time there are growing concerns that not technical specialists and government officials should be involved in decision making utilization of natural resources. Many groups within the society express the willingness and desire that they also want to be actively involved in decision making. This creates challenges to the researchers and forms a new situation confronting those actively involved in development of models and tools applied for decision making. WEB PIPA is a decision support system created to enhance the users to be involved in data input as well as decision making process. The recent advancement in the field of Internet has opened up new challenges as well as opportunities in the way we have been developing models and decision support aids. It is not only the medium of information access and communication but also a flourishing platf develop new generation of applications. With the emergence of revolutionary technology of web, now it has become possible to develop information systems distributed across different heterogeneous platform. This holds great promise for application in the food and agricultural systems which is highly diversified In this technological and information age, water is becoming a source of conflict between domestic, industrial and agricultural use. In Malaysia, irrigation has been exclusively devoted to the cultivation of rice paddy. The total land area planted with rice is about 600,545 ha of which 340,618 ha are supported by 600,545 ha of which 340,618 ha are supported by In many countries, the Internet has become an element in people’s daily life, offering new possibilities for information access and sharing. In this new technological and information age, water is coming a source of conflict between domestic, industrial and agricultural use. Web Based Tool is a platform allowing for a public participation in helping decision making processes situations, especially in cases involving many tier architecture framework was carefully studied and was implemented to create the model. This model is an Internet Based Model that is created to benefit the users in the water management sectors in order to make timely decisions to develop the water user group’s inline with the This system has been successfully ed to estimate the water productivity index and pH of soil on a micro scale based on the tertiary canal water user groups with the plot numbers alongside to allocate water without wastage. This system has the ability to provide access to those users assword who has the technical capabilities to connect to the Internet, hence bridging the digital divide between rural and urban communities. for information access and sharing. At the same time there are growing concerns that not only technical specialists and government officials should ed in decision making associated with utilization of natural resources. Many groups within the willingness and desire that they also want to be actively involved in decision making. This creates challenges to the researchers and situation confronting those actively involved in development of models and tools applied for decision making. WEB PIPA is a decision support system created to enhance the users to be involved in data input as well as decision making process. The t advancement in the field of Internet has opened up new challenges as well as opportunities in the way we have been developing models and decision support aids. It is not only the medium of information access and communication but also a flourishing platform to develop new generation of applications. With the emergence of revolutionary technology of web, now it has become possible to develop information systems distributed across different heterogeneous platform. This holds great promise for application in the food and agricultural systems which during during conflicting conflicting locations locations and and Water Management, Water PH, Productivity Index, Decision Decision Making. Making. In this technological and information age, water is becoming a source of conflict between domestic, industrial and agricultural use. In Malaysia, irrigation devoted to the cultivation of rice paddy. The total land area planted with rice is about the Internet has become an @ IJTSRD | Available Online @ www.ijtsrd.com Available Online @ www.ijtsrd.com | Special Issue Publication | November November 2018 P - 7
International Journal of Trend in Scientific Research and Development (IJTSRD) | ISSN: 2456-647 irrigation systems. The remaining area depends mainly on rainfall (APO, 1991).Irrigation water management is becoming a challenging issue. More importance has been given towards the improvement and effective management of water for the irrigation. Water is important for rice irrigation and it is scarcely available in some of the areas. Hence management of water becomes very important to cultivate rice. A good irrigation water management system has to be provided to give adequate and timely supply of water to improve the crop production. In order to achieve this, it is necessary to have adequate water source, a good conveyance system and good distribution system to distribute the water over the land. The agricultural scientific community has been developing models, databases, expert systems, decision support systems and software. The WEB PIPA is an example of DSS created to provide an effective conduit for the transfer of scientific knowledge from research labs to the end- users to support them in decision making. 2. STUDY AREA The selected study area is the Tanjung Karang Rice Irrigation Project. The project area is located on a flat coastal plain in the Northwest Selangor Agricultural Development Project (PBLS). It is in the districts of Kuala Selangor and SabakBernam, which cover an area of approximately 20,000 hectares extending over a length of 40 km along the coast with a average width of 5 km. The main irrigation and drainage canals run parallel with the coast. The Bernam River is the main water source for the project area. Water for the Tanjung Karang scheme is diverted from the Bernam River Head works (BRH), and the Bagan Terap Pump house, situated about 130 km and 62 km respectively upstream of the mouth of the Bernam River. The project area is divided into eight irrigation compartments and in to four Irrigation Scheduled Areas (ISA) as shown in the figure below. In the upstream six irrigation compartments from SawahSempadan to Sungai Nipah, tertiary canals directly connect to the main canal. About 50 farm lots are grouped in one sub- block. Out of the 19,247 ha, paddy fields comprise of 17,510 ha. The remaining area of about 1, 737 ha, comprise vegetable growing760 ha, for tree cropping 460 ha, and idle land of 510 ha. The annual yield of paddy is about 166,700 metric tons a year. The schematic diagram of the study area is given below; Fig 2: Schematic diagram showing the study area with compartment details Earlier study SMHB (1995) have acquired field data with respect to compartments and have calculated the irrigation parameters, whereas this study has emphasized data with respect to blocks and calculate the irrigation parameters. management, tertiary canals and CHO discharges should be considered with respect to block for calculating the irrigation parameters to properly manage the irrigation scheme. This study mainly emphasized on the application of Internet to acquire more data for a better decision support system. 3.METHODOLOGY This is one of the modules that are created along with three other Web based modules to determine the Water Productivity Index for paddy at a particular lot in the block. Fig 3, clearly shows the step by step procedure for analysis of Water User Group Webpage Module. Designing this module was very important from researcher’s point of view since most of the water managers and government officials do not know the net rice yield that is produced and sold by a particular For more precise Fig 1: Irrigation Scheduling Areas in Tanjung Karang Irrigation Scheme @ IJTSRD | Available Online @ www.ijtsrd.com | Special Issue Publication | November 2018 P - 8
International Journal of Trend in Scientific Research and Deve nd in Scientific Research and Development (IJTSRD) | ISSN: 2456-647 lot in the study area until much later. emphasized in designing a web based program where farmers or farm head are allowed to key in the accurate yield data from their lots. During this study farmers reported that it was difficult for them to key in the data through the internet. Keeping this in view MS Excel spreadsheet was created for the farmers, so that they could key in yield data. Once the yield data is keyed into the MS Excel spreadsheet which is based on whole season (Main season/Off season), for a particular subdivided bloc it is then accessed through admin id. In admin id, there is an option to directly upload the spreadsheet into the Water User Group Webpage Module. into the Water User Group Webpage Module. lot in the study area until much later. This study emphasized in designing a web based program where farmers or farm head are allowed to key in the The data stored in the WEB SQL database can be checked, viewed and edited if required in the station user mode (suser). The data can be only viewed in station user1 mode (suser1) and in administrator mode (admin) for this module. Administrator Id has the authority to delete or add more data files through the WEB based program. External data from MS Excel spreadsheet can be directly uploaded through this module to WEB SQL database. In this module the reports can be seen through the administrator The data stored in the WEB SQL database can be checked, viewed and edited if required in the station user mode (suser). The data can be only viewed in station user1 mode (suser1) and in administrator mod (admin) for this module. Administrator Id has the authority to delete or add more data files through the WEB based program. External data from MS Excel spreadsheet can be directly uploaded through this module to WEB SQL database. In this module the graph reports can be seen through the administrator user id. 3.1 WATER PRODUCTIVITY INDEX: The water productivity index measures effectiveness of the irrigation system in terms of gross rice yield and the total volume of water applied. The realistic range of the water productivity index should be from 0.30 to 0.60 kg/m3. In order to increase the rice yield per hectare and also to upgrade the water use efficiency it is very much important to improve the water productivity index. It is expressed below, water productivity index. It is expressed below, During this study farmers reported that it was difficult for them to key in the data through the internet. eeping this in view MS Excel spreadsheet was created for the farmers, so that they could key in yield data. Once the yield data is keyed into the MS Excel spreadsheet which is based on whole season (Main season/Off season), for a particular subdivided block, it is then accessed through admin id. In admin id, there is an option to directly upload the spreadsheet WATER PRODUCTIVITY INDEX: The water productivity index measures effectiveness of the irrigation system in terms of gross rice yield and the total volume of water applied. The realistic the water productivity index should be from . In order to increase the rice yield per hectare and also to upgrade the water use efficiency it is very much important to improve the 3.2 The pH of the soil affects plant production. Irrigation water or precipitation can change the pH of the soil overtime. Nutrients present in the soil may be unavailable to the plants due to a pH that is either too high or too low. Here PH is expressed with correlating Ec shallow of soil. PH= 4.899 – 0.0042 EC 3.3 WEB BASED WATER USER GROUP DSS This system is a standalone executable application. A 3 – tier architecture framework was carefully studied and was implemented to create the system. Web model is an Internet Based System that is created to benefit the users in the water management sector in order to make timely decisions on irrigation water supply. Web Model has the ability to provide almost unlimited access to information to everybody, who has the technical capabilities to connect to the Internet. This makes Web model particularly suitable for providing and disseminating information relevant to decision making processes concerning management of irrigation water resources. Specifically, Web model may be seen as a platform allowing for a public participation in resolving decision making processes involving many stakeholders and different water user groups. In such situations access to neutral and unbiased source of information about consequences of nformation about consequences of PH VALUE: The pH of the soil affects plant production. Irrigation water or precipitation can change the pH of the soil overtime. Nutrients present in the soil may be unavailable to the plants due to a pH that is either too H is expressed with correlating 0.0042 ECas + 1x 10⁻⁴ECas2 Fig 3: Step by Step Procedure for Analysis of Water User Group Webpage Module User Group Webpage Module Fig 3: Step by Step Procedure for Analysis of Water WEB BASED WATER USER GROUP DSS This system is a standalone executable application. A tier architecture framework was carefully studied to create the system. Web model is an Internet Based System that is created to benefit the users in the water management sector in order to make timely decisions on irrigation water supply. Web Model has the ability to provide almost formation to everybody, who has the technical capabilities to connect to the Internet. This makes Web model particularly suitable for providing and disseminating information relevant to decision making processes concerning management In this module the beginning stage is to determine the data that has to be stored in database for future use and once it is confirmed, the data has to be collected which is required for this particular web page design. In this module there are two options, one is to key in directly and other option is to upload through MS Excel spreadsheet directly through admin page. After data collection, user interface is to be designed according to the requirement, normally a user environment is designed. In this study interactive WebPages are created for user interface to login using User ID and Password. After login, the data is fed in the correct place and results are obtained. Once the results are obtained, check them for accuracy. If the results are accurate click on the save butt the data fields in the WEB SQL database. the data fields in the WEB SQL database. ing stage is to determine the data that has to be stored in database for future use and once it is confirmed, the data has to be collected which is required for this particular web page design. In this module there are two options, one is to key in ly and other option is to upload through MS Excel spreadsheet directly through admin page. After data collection, user interface is to be designed according to the requirement, normally a user-friendly environment is designed. In this study interactive Pages are created for user interface to login using User ID and Password. After login, the data is fed in the correct place and results are obtained. Once the results are obtained, check them for accuracy. If the results are accurate click on the save button and save Specifically, Web model may be seen as a platform allowing for a public participation in resolving decision making processes involving many stakeholders and different water user groups. In such situations access to neutral and @ IJTSRD | Available Online @ www.ijtsrd.com Available Online @ www.ijtsrd.com | Special Issue Publication | November November 2018 P - 9
International Journal of Trend in Scientific Research and Development (IJTSRD) | ISSN: 2456-647 possible policy and/or management strategies may contribute to constructive dialogue between parties involved and consequently help to overcome differences of positions dividing the parties and reach (if not an agreement), then at least reasonable compromise. The Water User Group model is created to determine the Water Productivity Index (WPI) and pH value in the webpage. Figure 4 shows the input parameters and output parameters clearly. The MS Excel spreadsheet will be uploaded through this webpage with administrator id only as an input. Output parameters are viewed in the webpage through the Web SQL database in all three different user modes. Figure 6, illustrates the results of water user group webpage outline for the admin users. The results shown here can only be viewed. The administrators will not be able to edit this webpage. The input parameters are uploaded through MS Excel database in the administrator mode. The uploaded data can be viewed in the above shown format in this webpage option. Fig 4: Web Based Water User Group Model 4.RESULTS The results derived from the program would be a major boost for the decision makers to make precise decisions on issues concerned to the Water User Group. The input parameters that are to be fed in to the program and output parameters obtained are shown in the figure 5. Fig 6: Web Page showing the results for Web Based Water User Group Fig 7: WUG Report Webpage Figure7 illustrates the WUG report webpage option for the admin users. In this page the administrator selects the compartment, block name, season and year which is denoted by season value. Once the block name is typed in the text box, there is scroll down option where the subdivision of the block (for example: Block C, sub blocks C1left, C1right, C2left and C2right) can be entered. After entering the required parameters by clicking the show report button and the graph report can be viewed on this same webpage Fig 5: Input and Output Parameters for Web Based Water User Group @ IJTSRD | Available Online @ www.ijtsrd.com | Special Issue Publication | November 2018 P - 10
International Journal of Trend in Scientific Research and Development (IJTSRD) | ISSN: 2456-647 3.Deepak T.J., MSM Amin, Rashid Sharifff, and Rahman Ramli 2010.- WebPIPA (Webbased Paddy Irrigation Productivity Decision Support System for Rice Irrigation Water Management, The IUP Journal of Soil & Water Sceinces (India), Vol.III.No.2 5.CONCLUSION The Web based system has been successfully developed to estimate the water productivity index and pH of soil on a micro scale based on the tertiary canal water user groups with the plot numbers alongside to allocate water without wastage. The “Water User Group” module was developed to give information on various parameters such as Water Productivity Index and pH value of soil. This module helps the decision makers in understanding the status of the plot based on the Water supplied and the Water Productivity Index achieved for a particular season. This module also shows the pH value of the soil for the particular season. Based on the results obtained the decision makers can conclude various aspects and from there future decisions made on Water allocation should benefit the farmers. This Web based system is particularly suitable for providing and disseminating information relevant to decision making processes concerning management of irrigation water. The Web based platform allows public participation in productivity index and pH of soil. It also has the ability to provide access to those users with password who has the technical capabilities to connect to the Internet, hence bridging the digital divide between rural and urban communities. Decisions made by people who have contributed in its making will be better accepted and implemented towards an improved productivity. 6.ACKNOWLEDGEMENTS Authors would like to thank the CITY University and Linton University College and its group of institution’s Top Management for their continuous support. University Putra Malaysia and G&P water is also acknowledged for their continuous support 7.REFERENCES 1.APO, Asian Productivity Management of Irrigation Facilities, Pg 227. (1991). Assessment)- 4.Fathima. Z.S. &Dillaha, T.A, Water Management for Lowland Rice Irrigation. J. Irrigation and Drainage Engineering, ASCE, vol.114, no 3:407- 423. (1988). 5.Labadie, J., River Basin Network Model for Water Rights Planning, MODSIM: Technical Manual, Department of Civil Engineering, Colorado State University, Fort Collins, Colorado, (1995). 6.Loucks, D. P., Sigvaldason, O.T., Multiple- reservoirs Operation in North America, in Z. Kaczmarek and J. Kindler (Eds.) The Operation of Multiple Reservoir Systems, IIASA Collaborative Proceedings Series CP-82-S3 pp. 1 – 104, International Institute for Applied Systems Analysis, Laxenburg, Austria.(1982). 7.Loucks, D. P., Salewicz K., A.,Taylor M., R., IRIS – an Interactive River System Simulation Program, User’s Manual International Institute for Applied Systems Analysis, Laxenburg, Austria, (1990). assessing the water Version 1.1. 8.Ramlee, B. J., Effect of Deep Percolation in Computing Water Use Efficiency for the Paddy Plots. MS Thesis, Engineering, UPM.( 1992). Serdang, Faculty of 9.Shim J., P., Warkentin M., Courtney J., F., Power D., J., Shards R., Carlsson Ch., Past, Present and Future of Decision Support Technology, Decision Support Systems, Nr. 33, pp. 111-126.(2002). 10.SMHB, Syed, Detailed Study of Water Resources Availability Northwest Agriculture Development Project, Final Report Vol. 1.(1995). Selangor Integrated Organization. 11.Zagona E. A., Fulp T., J., Goranflo H., M., Shane R., River Ware: A General River and Reservoir Modelling Environment, In: Proceedings of the First Federal Interagency Hydrologic Modelling Conference, Las Vegas, NV, pp. 5 - 113.(1998). 2.Booch, G., Object-Oriented Analysis and Design With Applications, Benjamin/Cummings Publishing Company, Inc., Redwood City, California, (1994). Second Edition, The @ IJTSRD | Available Online @ www.ijtsrd.com | Special Issue Publication | November 2018 P - 11