Download
1 / 21
210 likes | 222 Views
Water resource Planning and Drought are the major issues leading to significant water shortages and economic losses to all social classes of people. In this paper we present two water management techniques to minimize drought. These water management techniques help, farmers to demarcate conserve water potential zones especially in land locked areas to improve agricultural production. Relevant concepts are analyzed to strengthen these techniques they are Rainwater analysis, Run off analysis, Contour slope analysis, Agricultural Drought Severity Analysis, Water resource planning, Water shed basin parameters and water requirement for different crops. The study first investigated the historical Ground water maps, Dry cell maps Drought maps, Rainfall data, Crop production data, NDVI maps from 2005 2017. The Unique feature of the study is to demarcate water potential zones by using Bhuvan US geological Survey Remote Sensing data of different time lines. The main objective of the paper is to identify the water potential zones by using Weighted Overlay Analysis method WOA . This paper provides scientific methodology of finding exact locations of the water potential zones in drought prone areas and helps to strengthen Sustainable Agricultural practices. In Future these zones helps to estimate the amount of water to be stored and the amount of water which can be used for future agricultural purposes. Ganesh Raju J | Shweta Sharma "Identification of Water Potential Zones in Drought Prone Area's A Case Study of Rolla Mandal, Ananthapuram, Andhra Pradesh, India" Published in International Journal of Trend in Scientific Research and Development (ijtsrd), ISSN: 2456-6470, Volume-2 | Issue-2 , February 2018, URL: https://www.ijtsrd.com/papers/ijtsrd10715.pdf Paper URL: https://www.ijtsrd.com/engineering/architecture-and-planning/10715/identification-of-water-potential-zones-in-drought-prone-areau2019s-u2013-a-case-study-of-rolla-mandal-ananthapuram-andhra-pradesh-india/ganesh-raju-j<br>

E N D
International Research Research and Development (IJTSRD) International Open Access Journal International Journal of Trend in Scientific Scientific (IJTSRD) International Open Access Journal ISSN No: 2456 ISSN No: 2456 - 6470 | www.ijtsrd.com | Volume 6470 | www.ijtsrd.com | Volume - 2 | Issue – 2 Identification of Water Potential Zones in Drought Prone Area’s Case Study of Rolla Mandal, Ananthapuram, Andhra Pradesh, India Case Study of Rolla Mandal, Ananthapuram, Andhra Pradesh, India Case Study of Rolla Mandal, Ananthapuram, Andhra Pradesh, India Identification of Water Potential Zones in Drought Prone Area’s Identification of Water Potential Zones in Drought Prone Area’s – A 1Ganesh Raju J Ganesh Raju J, 2Shweta Sharma rchitecture), M.E.P.M (Masters in Environment Planning & Management) ol of Planning & Architecture, Vijayawada, Andhra Pradesh, India 1B.Arch (Architecture), M.E.P.M (Masters i 1,2 School of Planning & Architecture, Vijayawada n Environment Planning & Management) , India ABSTRACT Water resource Planning and Drought are the major issues leading to significant water shortages and economic losses to all social classes of people. In this paper we present two drought. These water management techniques help, farmers to demarcate / conserve water potential zones especially in land locked areas to improve agricultural production. Relevant concepts are analyzed to strengthen these techniques they are: Rainwater analysis, Run Severity Analysis, Water resource planning, Water shed basin parameters and water requirement for different crops. The study first investigated the historical Ground water maps, Dry cell maps / Drought maps, Rainfall data, Crop production data, NDVI maps from 2005 potential zones by using Bhuvan / US geological Survey / Remote Sensing main objective of the paper is to identify the water potential zones by using Weighted Overlay Analysis method (WOA). This paper provides scientific methodology of finding exact locations of the water potential zones in drought prone areas & helps to strengthen Sustainable Agricultural practices. In Future these zones helps to estimate the amount of water to be stored and the amount of water which can be used for future agricultural purposes. Keywords: RTOS- Ananthapuram, Weighted overlay Analysis, Drought, NDVI (Normalized Differential Vegetation Index), Water Shed analysis, Water Management, Rain water Potential Zones, Ground water Potential Zones Introduction Drought is defined as “the naturally occurring phenomenon th below normal recorded levels, causing serious hydrological imbalances that adversely affects land resource production systems” (UNCCD, 1999). The main causes of drought are, lack of water resource plannin locked areas & less ground water availability. According to the statistics, 68% of India's land is prone to drought. In India more than 100 million people live in the Areas of poor water quality and Accessibility. 54% of India faces extremely high water stress. 54% of ground water wells are decreasing every year. Nearly, 70% of agricultural production in India depends up on ground water for farming and other activities. Ground water irrigation blocks are increasing 5.5% every year which is a serio irrigation blocks are increasing 5.5% every year which is a serious issue to be solved. Water resource Planning and Drought are the major issues leading to significant water shortages and economic Water resource Planning and Drought are the major issues leading to significant water shortages and economic losses to all social classes of people. In this paper we present two water management techniques to minimize drought. These water management techniques help, farmers to demarcate / conserve water potential zones especially in land locked areas to improve agricultural production. Relevant concepts are analyzed to strengthen these techniques they are: Rainwater analysis, Run-off analysis, Contour / slope analysis, Agricultural Drought Severity Analysis, Water resource planning, Water shed basin parameters and water requirement for different Severity Analysis, Water resource planning, Water shed basin parameters and water requirement for different water management techniques to minimize drought. These water management techniques help, farmers to demarcate / conserve water potential zones especially in land locked areas to improve agricultural production. Relevant concepts are analyzed to strengthen off analysis, Contour / slope analysis, Agricultural Drought the historical Ground water maps, Dry cell maps / Drought maps, Rainfall data, Crop production data, NDVI maps from 2005 – 2017. The Unique feature of the study is to demarcate water potential zones by using Bhuvan / US geological Survey / Remote Sensing data of different time lines. The main objective of the paper is to identify the water potential zones by using Weighted Overlay Analysis method (WOA). This paper provides scientific methodology of finding exact locations of the water potential zones in ought prone areas & helps to strengthen Sustainable Agricultural practices. In Future these zones helps to estimate the amount of water to be stored and the amount of water which can be used for future agricultural estimate the amount of water to be stored and the amount of water which can be used for future agricultural the historical Ground water maps, Dry cell maps / Drought maps, Rainfall data, 2017. The Unique feature of the study is to demarcate water data of different time lines. The main objective of the paper is to identify the water potential zones by using Weighted Overlay Analysis method (WOA). This paper provides scientific methodology of finding exact locations of the water potential zones in ought prone areas & helps to strengthen Sustainable Agricultural practices. In Future these zones helps to Weighted overlay Analysis, Drought, NDVI (Normalized Differential Weighted overlay Analysis, Drought, NDVI (Normalized Differential Vegetation Index), Water Shed analysis, Water Management, Rain water Potential Zones, Ground water Vegetation Index), Water Shed analysis, Water Management, Rain water Potential Zones, Ground water Drought is defined as “the naturally occurring phenomenon that exists when precipitation has been significantly below normal recorded levels, causing serious hydrological imbalances that adversely affects land resource production systems” (UNCCD, 1999). The main causes of drought are, lack of water resource plannin locked areas & less ground water availability. According to the statistics, 68% of India's land is prone to drought. In India more than 100 million people live in the Areas of poor water quality and Accessibility. 54% h water stress. 54% of ground water wells are decreasing every year. Nearly, 70% of agricultural production in India depends up on ground water for farming and other activities. Ground water of agricultural production in India depends up on ground water for farming and other activities. Ground water at exists when precipitation has been significantly below normal recorded levels, causing serious hydrological imbalances that adversely affects land resource production systems” (UNCCD, 1999). The main causes of drought are, lack of water resource planning in land locked areas & less ground water availability. According to the statistics, 68% of India's land is prone to drought. In India more than 100 million people live in the Areas of poor water quality and Accessibility. 54% h water stress. 54% of ground water wells are decreasing every year. Nearly, 70% @ IJTSRD | Available Online @ www.ijtsrd.com @ IJTSRD | Available Online @ www.ijtsrd.com | Volume – 2 | Issue – 2 | Jan-Feb 2018 Feb 2018 Page: 1386
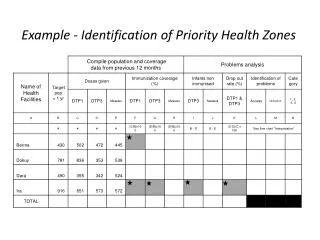
International Journal of Trend in Scientific Research and Development (IJTSRD) ISSN: 2456-6470 In order to minimize this issue Government of India started implementing (1972) “Integrated Water Shed Management Program”, in drought areas. In 1995 water shed management guide lines were formed to implement in all the states in India. In 1999 this program was implemented as “Andhra Pradesh rural employment scheme” to improve water management and crop production. States like Odisha, Andhra Pradesh, Rajasthan, Haryana, west Bengal and Uttar Pradesh crop production is decreasing every year due to poor water availability. In 2008 this program was implemented in all drought prone areas in Andhra Pradesh, to improve agricultural production. In Andhra Pradesh (2012) Ananthapuram, Chittoor, Kadapa, Vizianagaram, Mahbubnagar, Medak, Nalgonda are declared as Drought prone areas due to low water availability and gives a negative impact on crop production. Figure 1-1: Ananthapuram location map Figure 1-2: Ananthapuram Snapshot Ananthapuram District Details Total Area Rivers Rainfall Ground water Mandal’s Population Farmers Population Net area Sown Soil Structure 19.13 sq. kms / 7,390 sq. mi / 4727125.94 Acres Penna River, Chitravathi River 550 mm 10 – 20 m.bgl 63 (out of 63 mandals, 20 mandals are Drought affected) 40,83,000 3,77,000 2807117.13 Acres Clay, Cracking clay, Grove clay, Grove Loam, Loamy Soil Problem Identification The total geographical area of the district is 19.13 sq. kms. Net area sown is 10.48 Lakh Hectares, which forms 54.78% of the total area. The District occupies the lowest position in respect of Irrigation facilities with only 15.43% of the gross cropped area during 2011-2012. Ground water level is 10-20 m.bgl. Ananthapuram district observes lowest rainfall (553.0 MMs.) Ananthapuram is experiencing Tropical wet and dry climate, faces serious water shortage problems and challenge with water sustainability. Main agricultural crops grown in the district were ground nut, paddy, millets, green gram, Bengal gram, red gram, sugar cane, millets, jowar, ragi, vegetable crops. Due to less water availability Ground nut & some horticulture crops are practiced by all kinds of farmers. There are no water potential zones / rain water harvesting structures in the district as of now. Ananthapuram Government is not practicing any Water collecting / conservation programs as of now. @ IJTSRD | Available Online @ www.ijtsrd.com | Volume – 2 | Issue – 2 | Jan-Feb 2018 Page: 1387
International Journal of Trend in Scientific Research and Development (IJTSRD) ISSN: 2456-6470 Current irrigational system is also not organized and monitored, by government. Even, most of the small & medium scale farmers in Ananthapuram have no idea about advance water conservation techniques. This kind of water management system may lead to poor farming conditions in future. Due to water unavailability in different seasons, crop production is declining gradually and crop value is decreasing every decade, which is showing negative impact on farmer’s livelihood. Methodology Several back ground studies / research works were carried out to find appropriate solution to the problem. Water potential Zones, Water resource Planning, Drought severity and Crop Management are the core concepts, analyzed to identify the issue. Several research questions and multiple objectives were framed to analyze the case area in a logical approach. Primary and secondary data are used to analyzed all objectives / research questions. During field visit structured and semi structured interviews were conducted to find out different perceptions and suggestions from the Government officers / stakeholders / farmers. This study helps to analyze several concepts like Ground water maps, Dry cell maps / Drought maps, Rainfall data, NDVI maps, Agricultural Drought Severity Maps, Land Use maps, Soil maps, Rivers maps, Lineament maps, Geo Morphology maps of different timelines. In detail this approach helps us to identify water potential zones with exact location and dimensions too. To analyze objectives, different software’s and techniques are used. Statistical data is processed in MS excel and analyzed by creating bar graphs, maps and pie charts. AutoCAD and ARC GIS are used to create Land use maps, NDVI Maps (Agricultural Severity Maps), Contour maps, Soil Maps, Population Density maps, Ground Water maps. Determination of the basic resource information required for the production of various thematic maps Preparation of land use / land cover map of the year 2011 by digitizing WMS layer available at ISRO’s Bhuvan website. Preparation of district, mandal, and village boundary maps. Preparation of drainage network map Preparation of slope / Contour map Preparation of drainage density maps using Neighborhood tools from ArcGIS Spatial Extension. Preparation of geomorphology map by digitizing WMS layer available at ISRO’s Bhuvan website. Preparation of lineament map by digitizing WMS layer available at ISRO’s Bhuvan website. Preparation of lineament density map from lineament map data. Preparation of watershed map from Digital Elevation Model (DEM) data. Assigning of weights to different parameters according to their relative importance, to find out water potential zones based on the several qualitative literature and analytical hierarchy process. The thematic layers are finally integrated using ArcGIS desktop software to yield a groundwater potential zone map of the study area. Thus, three different groundwater potential zones are identified, namely Excellent, Very good, Good, Moderate, and Poor. @ IJTSRD | Available Online @ www.ijtsrd.com | Volume – 2 | Issue – 2 | Jan-Feb 2018 Page: 1388
International Journal of Trend in Scientific Research and Development (IJTSRD) ISSN: 2456-6470 Figure 1-3: Methodology Chart Literature Review Figure 1-4:Water Potential Zones @ IJTSRD | Available Online @ www.ijtsrd.com | Volume – 2 | Issue – 2 | Jan-Feb 2018 Page: 1389
International Journal of Trend in Scientific Research and Development (IJTSRD) ISSN: 2456-6470 Table 1-1: Literature Review Research Theme Studies on Water management Name Of The Article Sustainable Water Management in Urban, Agricultural, and Natural Systems Methodology Lessons Learnt Objectives Understanding the water usage pattern in Urban & Rural areas. Identifying major factors affecting (Tess Russo, 2014) water management Importance of watershed assessment Impact of Drainage structure on water management Not Available To Analyze the Current irrigational system. Landsat Tm Satellite Image (Top Sheets) Water shed map Landsat 8 images DEM Map Hydrological inferences from watershed analysis for water resource management using remote sensing and GIS techniques Agricultural Drought Severity Assessment Using Land Surface Temperature and NDVI in Nakuru region, Kenya. - 2011 Landsat Tm Satellite Image Band 3,4,6 Images Radiance Conversion NDVI LST map NDVI+LST = Agricultural Drought Map Soil textural Map Rainfall Surplus Map Soil Depth Map Slope map Ground Water Depth Map Land Cover Map Rain Water Harvesting Potential Zones. Drainage Density map Land use / Land Cover map Lineament Density map Geomorphology map Rainfall Estimates & NDVI can be used for Drought Monitoring & Early warning Systems LST provides moisture levels on agricultural land . Studies On Drought Severity To Analyze the Current vegetation cover. Improving Ground water potential through surface and rain water harvesting. Suitability maps for In Situ Rain water harvesting to minimize rain fed agricultural Practices. Analyzing current Drainage system. Identifying Groundwater Potential Zones. Studies On Identifying water Potential Zones Identification of potential rain water harvesting areas in the Central Rift Valley of Ethiopia using a GIS Based approach Ethiopia- Africa , 2009 . Identification of Potential Zones for Groundwater Recharge in Kosigi Mandal, Kurnool District, using Remote Sensing and GIS - 2015 To study & Delineate Water Potential Zones. To study existing @ IJTSRD | Available Online @ www.ijtsrd.com | Volume – 2 | Issue – 2 | Jan-Feb 2018 Page: 1390
International Journal of Trend in Scientific Research and Development (IJTSRD) ISSN: 2456-6470 Watershed Map Rainfall map Slope map Land use map Soil depth map Soil texture map Drainage density map Preparation of thematic maps from various sources Assigning weights & ranks to thematic maps Identifying ground water potential zones. Geospatial technology for delineating groundwater potential zones in Doddahalla watershed of Chitradurga district, India – 2016 Studies are carried out mainly related to Crop management, Water resource planning, Agricultural production, Drought severity & identification of water potential zones. Research Gap: Studies on water management & Agricultural production didn’t discuss on important aspects like, Crop level water demand, alternative coping patterns, Properties of vacant / barren land & parameters to demarcate water shed basins. Studies on identifying water potential zones didn’t discuss on important concepts like, Properties of water potential zones, workability parameters & durability aspects of water potential zones. Project area selection In Andhra Pradesh there are 34 severe drought affected mandals. In that Ananthapuram district contains 20 severe drought mandals, which are in vulnerable condition in terms of water scarcity and crop production. Based on the background studies / literature study, some parameters were identified to finalize the case study they are: Dry Cell map, Ground water map, Contour map, soil map, population data (Mandal Wise) and rivers map. Ranks and weights are given to these parameters by using Composite Index Method. Highest scoring area / Mandal is considered as more drought vulnerable. Figure 1-5: Andhra Pradesh Drought affected mandals @ IJTSRD | Available Online @ www.ijtsrd.com | Volume – 2 | Issue – 2 | Jan-Feb 2018 Page: 1391
International Journal of Trend in Scientific Research and Development (IJTSRD) ISSN: 2456 International Journal of Trend in Scientific Research and Development (IJTSRD) ISSN: 2456 International Journal of Trend in Scientific Research and Development (IJTSRD) ISSN: 2456-6470 Table 1-2:Mandal Criteria Selection :Mandal Criteria Selection – Composite Index method Composite Index method Ground Water level Map 4 4 2 4 4 4 Dry Cells Map Dry Cells Mandals Contours Population Rivers Soil Soil Total Gooty Yellanuru Guntakal Peddavadaguru Tadimarri Rolla 2 2 2 2 2 4 1 1 1 1 1 1 2 2 4 2 2 1 3 2 2 3 3 4 2 3 4 3 4 3 3 2 3 4 3 4 14 14 15 15 16 17 Rolla is a mandal in Ananthapuram District, Andhra Pradesh, located at 13.8331°N 77.1000°E. It has an Rolla is a mandal in Ananthapuram District, Andhra Pradesh, located at 13.8331°N 77.1000°E. It has an average elevation of 726 metres (2385 ft.). The villages in Rolla mandal includes: Jeerige Halli, H.M.palli, KG Gutta (Kodagari Gutta), HT Halli, Kaluve Halli, Mallinamadugu, Hunisekunta, Keriyalahalli, Hallikere, Mallasandra, TD Halli, Agrahara, Vannaranahalli, Somagatta, Bandrshalli, Bommagundanahalli, Dodderi, M. Rayapuram, Ratnagiri, Ranganahalli, Rolla, Rolla vadrahatti ,Rolla gollahatti, Kadupula Konda, Thimmarada palli, Hosur, Naasepalli, Sugaali Thaanda and Somagatta. Rolla falls under Madakasira Konda, Thimmarada palli, Hosur, Naasepalli, Sugaali Thaanda and Somagatta. Rolla falls under Madakasira Rolla is a mandal in Ananthapuram District, Andhra Pradesh, located at 13.8331°N 77.1000°E. It has an average elevation of 726 metres (2385 ft.). The villages in Rolla mandal incl Gutta (Kodagari Gutta), HT Halli, Kaluve Halli, Mallinamadugu, Hunisekunta, Keriyalahalli, Hallikere, Mallasandra, TD Halli, Agrahara, Vannaranahalli, Somagatta, Bandrshalli, Bommagundanahalli, Dodderi, Gudduguriki, Kaki, M. Rayapuram, Ratnagiri, Ranganahalli, Rolla, Rolla vadrahatti ,Rolla gollahatti, Kadupula Konda, Thimmarada palli, Hosur, Naasepalli, Sugaali Thaanda and Somagatta. Rolla falls under Madakasira Agricultural sub division. udes: Jeerige Halli, H.M.palli, KG Gutta (Kodagari Gutta), HT Halli, Kaluve Halli, Mallinamadugu, Hunisekunta, Keriyalahalli, Hallikere, Mallasandra, TD Halli, Agrahara, Vannaranahalli, Somagatta, Bandrshalli, Bommagundanahalli, Dodderi, M. Rayapuram, Ratnagiri, Ranganahalli, Rolla, Rolla vadrahatti ,Rolla gollahatti, Kadupula Most of the Rolla mandal consists of Denudation hills / low dissected hills and smaller portion of structural origin. Coarse, Fine and Medium textured red soil is witnessed in this mandal, which are moderately deep / shallow with less water holding capacity. Rainfall varies from 400 area witnesses critical ground water level of 10 area witnesses critical ground water level of 10 – 20 m.bgl and varies up to 5 – 10 m.bgl. s of Denudation hills / low dissected hills and smaller portion of structural origin. Coarse, Fine and Medium textured red soil is witnessed in this mandal, which are moderately deep / s of Denudation hills / low dissected hills and smaller portion of structural origin. Coarse, Fine and Medium textured red soil is witnessed in this mandal, which are moderately deep / shallow with less water holding capacity. Rainfall varies from 400- 600 mm/year, in case area. Majority of the mm/year, in case area. Majority of the 10 m.bgl. Table Table 1-3:Rolla Mandal Snapshot Rolla Mandal Details Area Villages River Soil Structure Irrigable Land Water Available Area Area under Drainage channels Area under water bodies Area Under Wells Rainfall Ground water Population Farmers Population Farmers Population Rolla Mandal Details 16,259 Acers 7 - Red 28,992 Acers 13,435 Acers 4,153 Acers 1,549 Acers 11,886 Acers 602.0 mm 10 - 20 mts 39,964 6,293 Soil Structure Irrigable Land Water Available Area Area under Drainage channels Area under water bodies - 23 Area Under Wells Ground water Population @ IJTSRD | Available Online @ www.ijtsrd.com @ IJTSRD | Available Online @ www.ijtsrd.com | Volume – 2 | Issue – 2 | Jan-Feb 2018 Feb 2018 Page: 1392
International Journal of Trend in Scientific Research and Development (IJTSRD) ISSN: 2456-6470 Figure 1-6: Location of Rolla, Andhra Pradesh, India Analysis SWOT Analysis SWOT analysis is carried out based on field visit, primary data, secondary data, Reconnaissance survey and farmer’s semi structured / informal interview. Strengths Well drained suitable soils for Cultivation Opportunities Increase of irrigation conservation Weakness Shallow depth soils & lowest rainfall Threats through water More exploitation of Ground water Initially Reconnaissance Survey was conducted in Rolla Mandal. Rainfall data, Crop data, Drainage data and Contour data is conceptually checked on site, by using possible references and real time maps. Informal / semi structured interviews were conducted with farmers to analyze the current issues, in different seasons regarding crop production and water management. To analyze the issues in different dimensions several concepts related to water resource planning / drought management were analyzed they are: Mandal Drainage Channels, Contour Analysis & Crop wise Irrigational Demand – Mandal Wise. @ IJTSRD | Available Online @ www.ijtsrd.com | Volume – 2 | Issue – 2 | Jan-Feb 2018 Page: 1393
International Journal of Trend in Scientific Research and Development (IJTSRD) ISSN: 2456 International Journal of Trend in Scientific Research and Development (IJTSRD) ISSN: 2456 International Journal of Trend in Scientific Research and Development (IJTSRD) ISSN: 2456-6470 Drainage / Contour Analysis Figure 1-7:Rolla Mandal Drainage Channels and Contour Analysis Mandal Drainage Channels and Contour Analysis Mandal Drainage Channels and Contour Analysis: As of now Rolla mandal Doesn’t have any Primary drainage channel / River passing through it. Half of the channels are falling in moderate contour area. Some channels are towards forest Area (Contour Level Overall Slope is varying from 4.5% Contours ranges from 636 – 876 mts (+MSL) Most of the contours are barren and fallow land, has high soil potential and drainage capacity. Most of the contours are barren and fallow land, has high soil potential and drainage capacity. Most of the contours are barren and fallow land, has high soil potential and drainage capacity. As of now Rolla mandal Doesn’t have any Primary drainage channel / River passing through it. As of now Rolla mandal Doesn’t have any Primary drainage channel / River passing through it. Half of the channels are falling in moderate contour area. Some channels are towards forest Area (Contour Level is High) Overall Slope is varying from 4.5% – 6.2 %. 876 mts (+MSL) Table 1-4: Exist Existing Irrigational Demand in Rolla Mandal Crop Types Paddy Jowar Bajra Maize Redgram Green gram 16.00 Groundnut Sunflower Castor Horticulture Crops Total Source: My Agriculture Information Bank Source: My Agriculture Information Bank – India Area in Hectares (Rolla) 50.00 30.00 0.00 36.00 381.00 Area in Hectares Growing Water Requirement Mts 0.9-1.2 0.6 0.45 0.6 0.45 0.45 0.6 0.45 0.6 Water required in MLD (Rolla) 600.00 180.00 0.00 216.00 1715.00 72.00 4861.00 878.00 Water required in MLD (Rolla) 600.00 180.00 0.00 216.00 1715.00 72.00 4861.00 878.00 0.00 0.00 Period in days 100-120 45-60 45-60 60-90 60-90 60-90 60-90 90-120 75-100 8102.00 195.00 0.00 18.00 Daily 0.3 54.00 54.00 8828 8576 8576 Food and commercial crops are practiced in Rolla mandal as of now. 90% of farmers depends up on Groundnut and Redgram crop. Water requirement is also high for these crops. Due to water unavailability, farmer directly depending upon ground water. Among all the crops Jowar and Bajra requires less time to grow and Paddy / sunflower crops take more to grow. Ground nut is the major crop witnessed in mandal because, it requires less water for cultivation and gives more production. ives more production. Food and commercial crops are practiced in Rolla mandal as of now. 90% of farmers depends up on Groundnut and Redgram crop. Water requirement is also high for these crops. Due to water unavailability, farmer directly depending upon ground water. Among all the crops Jowar and Bajra requires less time to grow and Paddy / sunflower crops take more to grow. Ground nut is the major crop witnessed in mandal because, it Paddy / sunflower crops take more to grow. Ground nut is the major crop witnessed in mandal because, it Food and commercial crops are practiced in Rolla mandal as of now. 90% of farmers depends up on Groundnut and Redgram crop. Water requirement is also high for these crops. Due to water unavailability, farmers are directly depending upon ground water. Among all the crops Jowar and Bajra requires less time to grow and @ IJTSRD | Available Online @ www.ijtsrd.com @ IJTSRD | Available Online @ www.ijtsrd.com | Volume – 2 | Issue – 2 | Jan-Feb 2018 Feb 2018 Page: 1394
International Journal of Trend in Scientific Research and Development (IJTSRD) ISSN: 2456-6470 Agricultural Production Analysis Graph 1-1:Rolla Mandal Ground Nut Production In Roll mandal Ground nut is sown in large extent. CAGR (2003 – 2017) of Ground nut production is 0.59% Approx.Growth rate of Production is around 4.14% in 2017 over 2016. Graph 1-2:Rolla Mandal Redgram Production In 2009 – 2010 this mandal didn’t witness Redgram production. CAGR (2003 – 2017) of Redgram production is 11.23% Approx. Growth rate of Production is around 29.2% in 2017 over 2016. Graph 1-3: Rolla Mandal Fresh Fruits Production CAGR (2003 – 2017) of Fresh fruits production is 1.44% Approx. Growth rate of Production is gone down - 8.33% in 2017 over 2016. @ IJTSRD | Available Online @ www.ijtsrd.com | Volume – 2 | Issue – 2 | Jan-Feb 2018 Page: 1395
International Journal of Trend in Scientific Research and Development (IJTSRD) ISSN: 2456-6470 Graph 1-4: Rolla mandal Vegetable Production In 2008 – 2009 this mandal didn’t witness Vegetable production. CAGR (2003 – 2017) of Redgram production is -6.28% Approx. Growth rate of Production is around 7.16% in 2017 over 2016. Graph 1-5: Rolla madla Greengram production From 2008 – 2010 this mandal didn’t witness Greengram production. CAGR (2003 – 2017) of Redgram production is -7.15% Approx. Growth rate of Production is around 11.79% in 2017 over 2016. Vegetation Severity Analysis: Landsat data from USGS, is used to create NDVI maps. Vegetation severity maps are prepared by using NDVI Analysis. By using Reclassification tool in ARC GIS Vegetation and land covers are extracted. Vegetation severity analysis is used to identify historical and current status of vegetation, green cover, agricultural land and other plantation area. @ IJTSRD | Available Online @ www.ijtsrd.com | Volume – 2 | Issue – 2 | Jan-Feb 2018 Page: 1396
International Journal of Trend in Scientific Research and Development (IJTSRD) ISSN: 2456-6470 Figure 1-8: Rolla Vegetation Index maps (2005, 2010 & 2015) In 2005 Vegetation cover and agricultural lands are in good condition. Plantation and green cover areas are more in 2005, when compared to 2010 & 2015 Vegetation Index maps. In 2010 Vegetation cover and agricultural lands are in moderate condition. Plantation and green cover decreased in 2010, when compared to 2005 Vegetation Index maps. In 2017 Vegetation cover and agricultural lands are in critical condition. Plantation and green cover reduced drastically when compared to 2005 Vegetation Index maps. From the above maps it was concluded that Vegetation and agricultural growth is decreasing from past 16 (Sixteen) years and establishes poor water management structure in this mandal. Detail Analysis – Water Potential Zones: Three different kinds of water potential zones are proposed they are: 1Ground water potential zones: This map is prepared by analyzing the Area Boundary maps, Existing drainage map, Soil pattern, Slope map, Elevation map Drainage density maps, lineament map & Geomorphology map. This map is used to 2Rainwater potential Zones: Rainwater potential maps are generated in two different ways: they are A)Pond Map: Pond map is prepared by considering Land cover map, Rainfall map, Slope map, Soil depth map, Soil texture map and Ground water map. This technique is exclusively used to conserve rainwater specially to serve agricultural / domestic purposes. The result map is classified into Excellent, very good, good, moderate and poor. B)Insitu Map: Insitu map is prepared by using Land cover map, Rainfall map, Slope map, Soil depth map and Soil texture map. Since this is used specially to minimize runoff and allows to prolong the infiltration. Hence, ground water table is not considered to prepare this map. Weighted Overlay Analysis: This process is well known as Weighted overlay analysis (WOA) or in some cases it also known as Multi criteria Analysis (MCA). Weighted overlay analysis is carried out in ARC GIS by using spatial Analysis tool. Weights and ranks are assigned to the different parameters (Maps), in order to obtain Ground water & Rain water potential zones. In order to avoid the variations, Theme guidelines prepared by National Remote Sensing Agency (NSRA,1995), ISRO platforms were used to assign scores. Based on the criteria, dependency, probabilities - weights & ranks are applied to arrive different scores & the same scoring is used to arrive Water potential maps. The weights and ranks were prioritized based on @ IJTSRD | Available Online @ www.ijtsrd.com | Volume – 2 | Issue – 2 | Jan-Feb 2018 Page: 1397
International Journal of Trend in Scientific Research and Development (IJTSRD) ISSN: 2456-6470 the water potentiality & water holding capacity. In this analysis total score or rank is multiples with weights to achieve water potential maps. A.Land use / Land Cover map: Basic approach to identify any kind of water potential zones are, to indicate the current land use. Because, different land-uses are having different soil properties and different runoff values, eventually it shows more impact on water resource planning. B.Geomorphology map: Geomorphology is the scientific study of different landforms and natural formation on earth. The geomorphological units like Denudational origins, dissected hills, structural origins, water bodies, structural lineaments etc. These are the critical parameters which decides, ground water moment. C.Drainage Density Map: Rolla mandal didn’t consist of any flowing river and primary drainage channel. It consists only secondary drainage channels in critical condition. Drainage density is indirectly related to run off & geological characteristics of the area. Drainage density is classified into very good, good, moderate and poor. D.Lineament Density map: Lineament is defined as the underlying linear structural features. Lineaments provide a proper pathway for ground water moment. Most of the area composed of structural lineaments (Joints / fractures / dyke), which allows water to filtrate very quickly. The lineament intersections are very important point for ground water moment. Well-developed fractures are the crucial aspect which improve the, quantity / moment of groundwater. E.Ground water map: Ground water map helps to analyze the ground water level in different seasons (Monsoon / Non monsoon) of the case area. The groundwater depth layer was generated by digitizing the hydrological map of the project area which was obtained from the Ministry of Water Resource, India. The dataset has two kinds of two classifications they are: 5 -10 m.bgl & 10 - 20 m.bgl. F.Soil Texture map: Soil Textures data of the project area is obtained from regional agricultural Research station, Rekulakunta, Ananthapuram. This dataset has three textural classes namely coarse, medium and fine / medium. Case area consists of, Red soil with cracking nature & has very low potential to hold water moisture. G.Soil Depth map: Soil Textures data of the project area is obtained from regional agricultural Research station, Rekulakunta, Ananthapuram. Later it was digitized, by taking the base of land use data. This dataset has three depth classes namely deep (100-150 cm), moderately deep (75-100 cm) & Moderately shallow (50-75 cm). H.Water Shed Analysis: A watershed is defined as geographic division between two or more adjacent catchment basins or river basins. As of now Rolla mandal doesn’t have any primary drainage channel, entire mandala was occupied by secondary narrow drainage channels. Rolla mandal stream network is also very poor, in terms of flow direction. Water shed analysis is carried out in ARC GIS, by using Landsat images / DEM data of project area. Dem Data, Flow Direction tool, Sink tool, watershed tool, Flow direction tool & flow length tools are used in a hierarchy to delineate water shed basins for project area. Based on the analysis, entire project area was divided into five water shed basins. The study area is having maximum slope of 6.2%, which is very critical to judge water moment and allows water to infiltrate in all seasons. I.Formula: The following formula is used to find Ground water potential zones. Lookup ("Land cover_shp12","W") * Lookup ("Land cover_shp12","R") + Lookup ("Drainage density_shp1","W") * Lookup ("Drainage density_shp1","R") + Lookup ("Lineament Density_shp4","W") * Lookup ("Lineament Density_shp4","R") + Lookup("Geomorphology_shp7","R"). Similar kind of formula is used to demarcate rainwater potential zones. Lookup("Geomorphology_shp7","W") * @ IJTSRD | Available Online @ www.ijtsrd.com | Volume – 2 | Issue – 2 | Jan-Feb 2018 Page: 1398
International Journal of Trend in Scientific Research and Development (IJTSRD) ISSN: 2456-6470 Figure 1-9: Rolla Watershed Map Ground Water Potential map: Ground water potential zone is prepared by analyzing Land use map, Lineament density map, Drainage density map and Geo morphology map by assigning appropriate ranks and weights. This analysis is carried out in ARCGIS 10.2.2. to generate real time maps. This technique is generally used in water scarce areas / drought areas to store water in larger scale. The result map is classified into Excellent, very good, good, moderate and poor Table 1-5:Ranks and Weightages for various parameters for Groundwater Potentiality Ranks Thematic Maps Details Individual Score Weightage (Sum of Individual score) Density Values 1 -13.0 13 -27 27 - 40.5 40.5 - 54 Density Values 01 - 13.0 13 - 26 26 - 39 39 - 52 Water Body Denudational Origin - Low Dissected Hills Denudational Origin structural origin - Low Dissected Hills Built-up Area Barren Land Scrub Forest Plantation / Crop Land River / Pond 2 3 4 5 Drainage Density map 4 14 2 Lineament Density 3 3 4 5 5 14 4 Geomorpholog y 2 14 3 2 1 2 3 4 5 1 Land Cover 15 @ IJTSRD | Available Online @ www.ijtsrd.com | Volume – 2 | Issue – 2 | Jan-Feb 2018 Page: 1399
International Journal of Trend in Scientific Research and Development (IJTSRD) ISSN: 2456-6470 Figure 1-10:Rolla Ground Water Map Rainwater Maps: Rainwater potential maps are generated in two different ways: they are A) Pond map B) Insitu Map. Rolla (Rainwater Potential) Pond map Pond map is prepared by considering Land cover map, Rainfall map, Slope map, Soil depth map, Soil texture map and Ground water map. This technique is exclusively used to conserve rainwater specially to serve agricultural / domestic purposes. Table 1-6: Ranks and Weightages for various parameters for Rainwater – Pond Potentiality Sl. No Weightages Thematic Maps Thematic Features Values / Details Individual Score Weightage (Sum of Individual score) Soil Textural Class Fine Medium Coarse Particle size in MM 0.25 - 0.10 0.5 - 0.25 1.00 - 0.50 Depth Value CMS 100-150 10 - 25. 25 – 50 Pond Suitability 5 3 1 Soil Texture Map 1 6 9 In Soil Depth Class Pond Suitability Soil depth Map Deep Extremely Shallow Shallow Rain fall Surplus Class Values large deficit medium deficit surplus 5 2 3 Pond Suitability 2 3 5 2 5 10 150 - 225 mm 225-300mm 300-325 mm Rain Fall Map 3 4 10 @ IJTSRD | Available Online @ www.ijtsrd.com | Volume – 2 | Issue – 2 | Jan-Feb 2018 Page: 1400
International Journal of Trend in Scientific Research and Development (IJTSRD) ISSN: 2456-6470 Sl. No Weightages Thematic Maps Thematic Features Values / Details Individual Score Weightage (Sum of Individual score) Topography flat undulating rolling hilly Ground Water Depth large deficit medium deficit surplus Land Cover class Very High High Medium Low Restricted Slope (%) 4-7. 7-9. 9-12. 12-16. Depth 10-20. 5-10. 2-5. Land Cover Types Agricultural Land Fallow land Barren Land Forest Land water body/settlements Pond Suitability 5 4 3 2 Pond Suitability 2 4 5 Pond Suitability 5 5 2 1 Topogra phy map 4 1 14 Ground water map 5 3 11 Land cover map 6 2 13 Very Low Restricted 0 Figure 1-11: Rolla rain water - Pond Map @ IJTSRD | Available Online @ www.ijtsrd.com | Volume – 2 | Issue – 2 | Jan-Feb 2018 Page: 1401
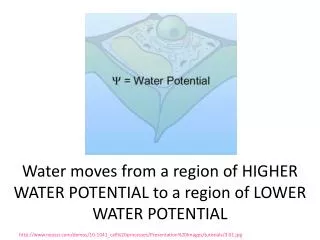
International Journal of Trend in Scientific Research and Development (IJTSRD) ISSN: 2456-6470 Rolla (Rainwater Potential) Insitu map Insitu map is prepared by using Land cover map, Rainfall map, Slope map, Soil depth map and Soil texture map. Since this is used specially to minimize runoff and allows to prolong the infiltration. Hence, ground water table is not considered to prepare this map. Essentially this technique evaluates current soil condition, soil texture and other geological parameters. This technique is implemented to serve mixed cropping and largescale vegetation / Horticultural crops. This map is mostly used to serve Rain fed Agricultural crops. The result map is classified into Excellent, very good, good, moderate and poor. Table 1-7: Ranks and Weightages for various parameters for Rainwater – In Situ Potentiality Weightage (Sum Individual score) Sl.No Weightages Thematic Thematic Features Individual Score of Values / Details Maps Soil Class Fine Medium Coarse Soil Class Deep Extremely Shallow Shallow Rain fall Surplus Class large deficit medium deficit surplus Textural particle size in MM 0.25 - 0.10 0.5 - 0.25 1.00 - 0.50 Depth Value In CMS 100-150 In Suitability 2 5 2 In Suitability 5 situ Soil Texture Map 1 6 9 Depth situ Soil depth Map 2 5 10 - 25. 1 9 25 - 50 3 In Suitability 2 3 5 In Suitability 2 4 3 2 In Suitability 0 0 0 In Suitability situ Values Rain Map Fall 150 - 225 mm 225-300mm 300-325 mm 3 4 10 situ Topography Slope (%) flat undulating rolling hilly Ground Depth large deficit medium deficit surplus Land class 4-7. 7-9. 9-12. 12-16. Topography map 4 1 11 Water situ Depth Ground water map 10-20. 5-10. 2-5. Land Types Agricultural Land Fallow land Barren Land Forest Land water body/settlements 5 3 0 Cover Cover situ Very High 5 Land cover map High Medium Low Restricted Very Restricted 5 1 1 6 2 12 Low 0 @ IJTSRD | Available Online @ www.ijtsrd.com | Volume – 2 | Issue – 2 | Jan-Feb 2018 Page: 1402
International Journal of Trend in Scientific Research and Development (IJTSRD) ISSN: 2456-6470 Figure 1-12: Rolla Rain water - Insitu Map Water Potential Zones – Area Statement’s: Table 1-8: Rolla - Ground water Potential Zone Area Statements Potential Zone Typology Ground Water Potential Area Rain Water Potential – Pond Map Rain Water Potential – Insitu Map Total Water Potential Areas Total Area (Acres) 266.7 190.5 267.7 724.89 Current Land Use in Project Area Barren Land / Water Bodies Barren Land / Water Bodies Barren Land / Water Bodies Most of the ground water potential zones falls under Barren land & water bodies. Conservation of these areas may reduce drought intensity to some extent. Thus it helps farmers to practice agriculture throughout the year. Most of the Rain water potential zones falls under Barren land & water bodies. These areas will have more potential to save rain water, without depending upon the Ground water level. These kinds of water potential zones in drought areas will helps to boost up agricultural production, to some extent. Conclusion Study area is limited to Ananthapuram District – Mandal level. The main aspect of the study was to create sustainable water management in drought areas, especially focusing on rural areas. This study is an attempt to delineate water potential zones in drought prone areas, to reduce drought intensity. It also involves the preparation of various thematic maps, which are very important parameters to prepare water potential by using weighted overlay analysis method. Important aspects like SWOT analysis, drainage & contour analysis, Vegetation severity analysis and water shed analysis are carried out to analyze problem from various @ IJTSRD | Available Online @ www.ijtsrd.com | Volume – 2 | Issue – 2 | Jan-Feb 2018 Page: 1403
International Journal of Trend in Scientific Research and Development (IJTSRD) ISSN: 2456-6470 dimensions. Weighted overlay analysis method is used to assign weights & ranks to various thematic maps like Land use / Land Cover map, Geomorphology map, Drainage Density map, Lineament Density map, Ground water map, Soil texture map, Soil depth map. All the thematic maps are analyzed in Geographic Information System (GIS) to identify Ground water & Rain water potential zones. This kind of approach is very logical and constructive. From the results, the water potential zones achieved were: Ground water potential zone 266.7 (Acres), Pond Map (Rain water potential zone) 190.5 (Acres), Insitu Map (Rain water potential zone) 267.7 (Acres). These zones are considered as potential zones to conserve water in all seasons, for irrigational purposes. From the analysis it was very clear that lineaments, geomorphology, ground water & slope are the major factors affecting water flow & water moment. Lineament density (30 – 52), drainage density (40 - 52), Geomorphology (denudational origin with low dissected hills) are the major areas to form ground water potential zones. Fracture points (lineament intersections), slope areas (4.5% - 5.5%) & ground water level (10 – 20 m.bgl) are the intersection points to form rain water potential zones. Government should take necessary steps to conserve these areas. Conservation & usage of, these zones may help to minimize the drought to some extent. This research can act as basic model to improve current irrigational structure & eventually helps to conserve water for future purposes. By involving more technical aspects like water quality, BOD & COD levels, Water flow and routing options, ground water moment prediction models, socio economic conditions of farmers etc. can be added to future studies in order to analyze / solve drought severity, from different dimensions. Acknowledgement: Authors thank Joint Director of Agriculture, District water management agency, Horticulture department, Soil department, Irrigation board, Agriculture research station, Tungabhadra irrigation department & Statistical department for permission & extending support for publishing this work. Authors also thank all the farmers who supported for collecting mandal level crops / irrigation details. References 1)A. Akinlalu a, A. A. (2017). Application of multi-criteria decision analysis in prediction of groundwater resources potential: A case of Oke-Ana, Ilesa Area Southwestern, Nigeria. NRIAG Journal of Astronomy and Geophysics . 2)Amit Daiman, N. G. (2015). Identification of Ground water Potential & Rainwater Harvesting Sites Using Geoinformatics - A Case Study of Karwan Water Shed Sagar District of Madhya Pradesh . Journal of Geoinfomatics . 3)Basavaraj Hutti, N. R. (2011). Identification of Groundwater Potential Zone using Geoinformatics In Ghataprabha Basin, North Karnataka, India,. International Journal of Geomatics and Geosciences, Volume 2. 4)Behzad Rayegani a, S. B. (2016). Remotely sensed data capacities to assess soil degradation. The Egyptian Journal of Remote Sensing and Space Sciences . 5)Binay Kumar, U. K. (2011). , Ground water recharge zonation mapping and modeling using Geomatics techniques . International Journal of Environmental Sciences, Volume 1, No 7. 6)Biswas Arkoprovo, J. A. (2012). Delineation of Groundwater Potential Zones using Satellite Remote Sensing and Geographic Information System Techniques: A Case study from Ganjam district, Orissa. India Research Journal of Recent Sciences, Vol. 1(9). 7)CGWB. (2013). Master Plan for Artificial Recharge to Groundwater in India, Ministry of Water Resources, Govt. of India. 8)Development, O. f. (2010). Sustainable Management of Water Resources in Agriculture. OECD publications. @ IJTSRD | Available Online @ www.ijtsrd.com | Volume – 2 | Issue – 2 | Jan-Feb 2018 Page: 1404
International Journal of Trend in Scientific Research and Development (IJTSRD) ISSN: 2456-6470 9)Dinesan V Pa, G. G. (2015). Application of Geoinformatics for the Delineation of Groundwater Prospects Zones- a Case Study for Melattur Grama Panchayat in Kerala, India. ScienceDirect. 10)Guru Balamurugan, K. S. (2016). Frequency ratio model for groundwater potential mapping and its sustainable management in cold desert, India. Science Direct. 11)H. B. BALAKRISHNA, K. C. (2014). Identification of Potential Sites for Rainwater Harvesting using RS and GIS . Basha Research Centre . 12)Harish Chand Prasad, P. B. (2014 ). Site Suitability Analysis of Water Harvesting Structures Using Remote Sensing and GIS – A Case Study of Pisangan Watershed, Ajmer District, Rajasthan. The International Archives of the Photogrammetry, Remote Sensing and Spatial Information Sciences, Volume XL-8 . 13)Hsin-Fu Yeh, Y.-S. C.-I.-H. (2016). Mapping groundwater recharge potential zone using a GIS approach in Hualian River, Taiwan. ScienceDirect - Sustainable Environment Research. 14)I.P. Senanayake, D. D. (2015). An approach to delineate groundwater recharge potential sites in Ambalantota, Sri Lanka using GIS techniques. Elsevier. 15)ICRISAT. (2006). Innovative farmer participatory integrated watershed Management Flood Model: Adarsha Watershed, Kothapally, and India . Global Theme on Agro Ecosystems - Report No 10. 16)Jha, M. C. (2007). Groundwater management and development by integrated remote sensing and geographicinformation systems: Prospects and constraints. Water Resources Management. 17)K. Ibrahim-Bathis, S. A. (2016). Geospatial technology for delineating groundwater potential zones in Doddahalla watershed of Chitradurga district, India. Elsevier. 18)Ketsela, G. M. ( 2009). Identification of potential rain water harvesting areas in the Central Rift Valley of Ethiopia using a GIS Based approach Ethiopia- Africa. Agricultural and Bioresource Engineering. 19)Khan, T. H. (2014). Water scarcity and its impact on agriculture, Case study of Layyah, Pakistan. Faculty of Natural Resources and Agricultural Sciences. 20)Kipterer John Kapoi, O. A. (2011). Agricultural Drought Severity Assessment Using Land Surface Temperature and NDVI In Nakuru region, Kenya. Regional Centre for mapping of resources for development (RCMRD). 21)M. Kamel a, M. Y. (2016). Utilization of ETM+ Landsat data in geologic mapping of wadi Ghadir-Gabal Zabara area, Central Eastern Desert, Egypt. Elsevier. 22)P., S. D. (2016). Application of GIS for Mapping Rainwater Harvesting Potential : A case study of Nidhal Village in Satara District, Maharastra. . IMPACT: International Journal of Research in Applied, Natural and Social Sciences (IMPACT: IJRANSS). 23)Prafull Singh, A. G. (2014). Hydrological inferences from watershed analysis for water resource management using remote sensing and GIS techniques. Elsevier. 24)R.Ayyanduraib, S. V. (2015). Groundwater Potential Zoning in Upper Gadilam River Basin Tamil Nadu . Science Direct. 25)Raj, D. (2011). Rain Water Harvesting Potential of Pallavapuram Area of Meerut: A GIS Study . 12th Esri India User Conference 2011 . 26)ravikumar a, m. k. (2016). Identification of potential sites for Rain Water Harvesting structures using RS, GIS and MIF Techniques . International Journal of Innovative Research in Science & Engineering . 27)S.Venkateswaranb, M. P. (2015). Delineation of Artificial Recharge Zones Using Geospatial Techniques In Sarabanga Sub Basin Cauvery River, Tamil Nadu. ScienceDirect. 28)Sankaran Rajendran a, A. R.-S.-A. (2016). Vegetation analysis study in and around Sultan Qaboos University, Oman, using Geoeye-1 satellite data . Elsevier. @ IJTSRD | Available Online @ www.ijtsrd.com | Volume – 2 | Issue – 2 | Jan-Feb 2018 Page: 1405
International Journal of Trend in Scientific Research and Development (IJTSRD) ISSN: 2456-6470 29)SankarḂ, R. P. (2015). Identification of Potential Zones for Groundwater Recharge in Kosigi Mandal, Kurnool District, using Remote Sensing and GIS. International Journal of Current Engineering and Technology. 30)Sara Delaney. (2012). Challenges and opportunities for agricultural water management in West and Central Africa: lessons from IFAD experience. International Fund for Agricultural Development (IFAD). 31)Saravanan, S. (2012). Identification of Artificial Recharge Sites in a Hard Rock Terrain using Remote Sensing and GIS. International Journal of Earth Sciences and Engineering, Volume 05, No. 06. 32)Shivaji Govind Patil, N. M. (2014). Identification of groundwater recharge potential zones for a watershed using remote sensing and GIS . International Journal of Geomatics and Geosciences - Volume 4 . 33)Tess Russo, K. A. (2014). Sustainable Water Management in Urban, Agricultural, and Natural Systems. Multidisciplinary Digital Publishing Institute. 34)William Teikeu Assatse a, P. N. (2016). Hydrogeological activity of lineaments in Yaounde Cameroon region using remote sensing and GIS techniques. Elsevier. 35)Yousef Ali H.a, C. N. (2015). Delineation of Groundwater Potential Zones in Deep Midland Aquifers along Bharathapuzha River Basin, Kerala using Geophysical Methods. ScienceDirect. @ IJTSRD | Available Online @ www.ijtsrd.com | Volume – 2 | Issue – 2 | Jan-Feb 2018 Page: 1406