Download
1 / 6
60 likes | 64 Views
In cracking palm nuts by application of appropriate impact energy, one of the predominant factors that would enhance the release of either high percentage of whole or split kernels is the percentage level of moisture content in the nuts. The split kernels encourage rancidity of oil since the oily surface of the kernel is exposed to environmental influence. There is therefore need to study the absorption of water in dried palm nuts as a pointer to condition dried nuts to moisture content range that would enhance the production of whole kernels. In this study, dried Dura and Tenera palm nuts varieties were obtained from a palm oil processing mill, classified based on their minor diameter into three size ranges of small, medium and large sizes. These nuts were further dried to bone dry mass followed by immersion of each size range of nuts into different vessels containing water. The rate of water absorption was monitored at 3 hourly intervals. The data generated were analyzed. The result showed that the rate of water absorption per nut unit area had similar curves pattern as the drying curve established for palm nuts. Models for water absorption process involving the dried palm nut was developed based on basic underlying principles and data generated from experimental runs. The models were then validated and found to be very useful in describing the water absorption process per nut unit area in a given time and predicting moisture content of bone dry mass of nut soaked in water and kept at room temperature. Orua Antia | Ubong Assian | Olosunde William "Modeling of Water Absorption by Dried Palm Nut Soaked at Room Temperature" Published in International Journal of Trend in Scientific Research and Development (ijtsrd), ISSN: 2456-6470, Volume-3 | Issue-3 , April 2019, URL: https://www.ijtsrd.com/papers/ijtsrd23471.pdf Paper URL: https://www.ijtsrd.com/engineering/food-engineering/23471/modeling-of-water-absorption-by-dried-palm-nut-soaked-at-room-temperature/orua-antia<br>

E N D
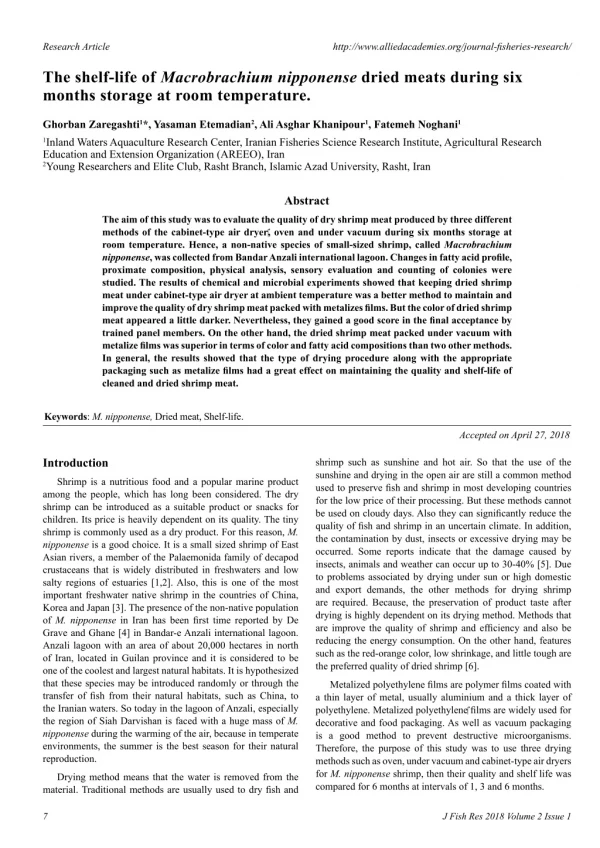
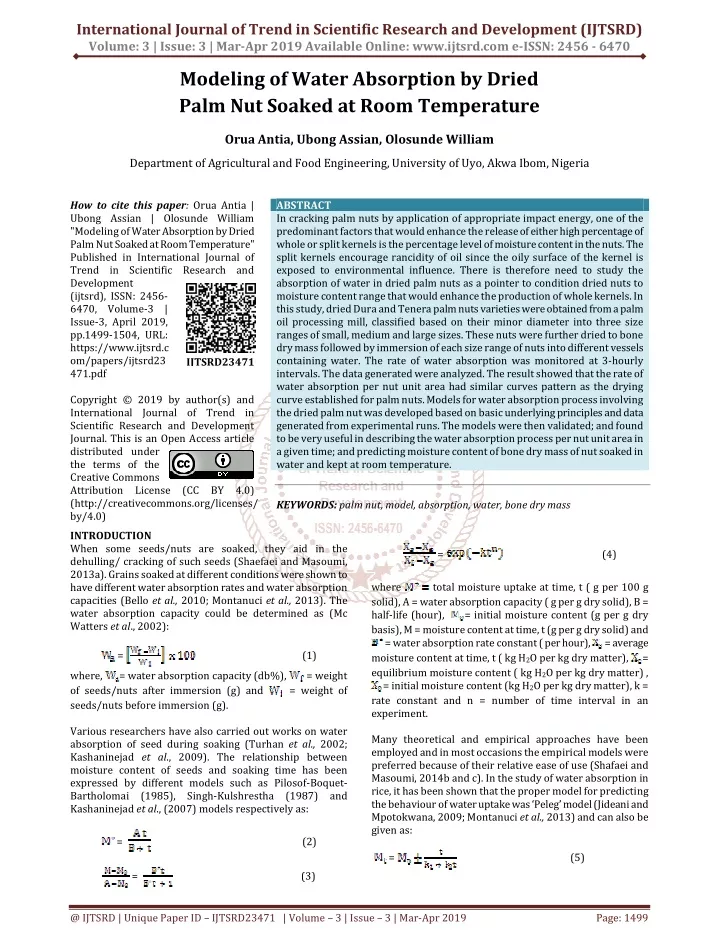
International Journal of Trend in Scientific Research and Development (IJTSRD) Volume: 3 | Issue: 3 | Mar-Apr 2019 Available Online: www.ijtsrd.com e-ISSN: 2456 - 6470 Modeling of Water Absorption by Dried Palm Nut Soaked at Room Temperature Orua Antia, Ubong Assian, Olosunde William Department of Agricultural and Food Engineering, University of Uyo, Akwa Ibom, Nigeria How to cite this paper: Orua Antia | Ubong Assian | Olosunde William "Modeling of Water Absorption by Dried Palm Nut Soaked at Room Temperature" Published in International Journal of Trend in Scientific Research and Development (ijtsrd), ISSN: 2456- 6470, Volume-3 | Issue-3, April 2019, pp.1499-1504, URL: https://www.ijtsrd.c om/papers/ijtsrd23 471.pdf Copyright © 2019 by author(s) and International Journal of Trend in Scientific Research and Development Journal. This is an Open Access article distributed under the terms of the Creative Commons Attribution License (CC BY 4.0) (http://creativecommons.org/licenses/ by/4.0) INTRODUCTION When some seeds/nuts are soaked, they aid in the dehulling/ cracking of such seeds (Shaefaei and Masoumi, 2013a). Grains soaked at different conditions were shown to have different water absorption rates and water absorption capacities (Bello et al., 2010; Montanuci et al., 2013). The water absorption capacity could be determined as (Mc Watters et al., 2002): = (1) ABSTRACT In cracking palm nuts by application of appropriate impact energy, one of the predominant factors that would enhance the release of either high percentage of whole or split kernels is the percentage level of moisture content in the nuts. The split kernels encourage rancidity of oil since the oily surface of the kernel is exposed to environmental influence. There is therefore need to study the absorption of water in dried palm nuts as a pointer to condition dried nuts to moisture content range that would enhance the production of whole kernels. In this study, dried Dura and Tenera palm nuts varieties were obtained from a palm oil processing mill, classified based on their minor diameter into three size ranges of small, medium and large sizes. These nuts were further dried to bone dry mass followed by immersion of each size range of nuts into different vessels containing water. The rate of water absorption was monitored at 3-hourly intervals. The data generated were analyzed. The result showed that the rate of water absorption per nut unit area had similar curves pattern as the drying curve established for palm nuts. Models for water absorption process involving the dried palm nut was developed based on basic underlying principles and data generated from experimental runs. The models were then validated; and found to be very useful in describing the water absorption process per nut unit area in a given time; and predicting moisture content of bone dry mass of nut soaked in water and kept at room temperature. KEYWORDS: palm nut, model, absorption, water, bone dry mass IJTSRD23471 = (4) where solid), A = water absorption capacity ( g per g dry solid), B = half-life (hour), = initial moisture content (g per g dry basis), M = moisture content at time, t (g per g dry solid) and = water absorption rate constant ( per hour), moisture content at time, t ( kg H2O per kg dry matter), equilibrium moisture content ( kg H2O per kg dry matter) , = initial moisture content (kg H2O per kg dry matter), k = rate constant and n = number of time interval in an experiment. Many theoretical and empirical approaches have been employed and in most occasions the empirical models were preferred because of their relative ease of use (Shafaei and Masoumi, 2014b and c). In the study of water absorption in rice, it has been shown that the proper model for predicting the behaviour of water uptake was ‘Peleg’ model (Jideani and Mpotokwana, 2009; Montanuci et al., 2013) and can also be given as: = total moisture uptake at time, t ( g per 100 g = average = where, of seeds/nuts after immersion (g) and seeds/nuts before immersion (g). Various researchers have also carried out works on water absorption of seed during soaking (Turhan et al., 2002; Kashaninejad et al., 2009). The relationship between moisture content of seeds and soaking time has been expressed by different models such as Pilosof-Boquet- Bartholomai (1985), Singh-Kulshrestha (1987) and Kashaninejad et al., (2007) models respectively as: = water absorption capacity (db%), = weight = weight of = (2) (5) = (3) @ IJTSRD | Unique Paper ID – IJTSRD23471 | Volume – 3 | Issue – 3 | Mar-Apr 2019 Page: 1499
International Journal of Trend in Scientific Research and Development (IJTSRD) @ www.ijtsrd.com eISSN: 2456-6470 Where, moisture content (d.b. %), t = time (h), Peleg rate (h per %) and Peleg capacity constant (per %), respectively. In (5), ‘‘±’’ becomes ‘‘+’’ if the process is absorption or adsorption and ‘‘_’’ if the process is drying or desorption (Corzo et al., 2012). The rate of sorption ( ) can be gotten from the first derivative of the Peleg equation: = = The Peleg rate constant, relates to sorption rate at the beginning ( ), at t = to: = = = moisture content at time t (d.b. %), = initial are the The negative sign of the moisture content indicates absorption while positive sign indicates desorption. The rate of absorption is suggested to depend on among any other possible things the following state of the system: a.The size of the material, b.The material thickness of the shell/skin, c.The nature of the material ( plastic, porous, etc) shell/skin, d.The temperature of the medium (liquid) that is used for absorption. The rate of absorption ( ) of water can therefore be defined as: = K ƒ ( state of the system) Where, K is absorption rate constant. Based on general material balance: Accumulation = input – output + generation For absorption of water, the generation is zero, while there is accumulation of water as a result of soaking of the dried nuts in water. Let’s denote input as (mass of nut at bone dry); and output as (mass of nut at any time t during absorption). + Where, = mass of water absorbed From (17) = = input – output Since palm nuts have various sizes irrespective of its variety, it is necessary to standardize the water absorption with respect to unit area of the material (nut). Hence, (18) and (19) become: = = and (6) (15) (7) The Peleg coefficient constant, k2 relates to maximum (or minimum) possible moisture content. As t = , (5) gives the relationship between equilibrium moisture content (Me) and k2. = = (16) (8) The Peleg model has been used to describe sorption processes in various food materials. Oliveira et al., (2013) studied simultaneous water desorption and sucrose absorption of adzuki beans; Prasad et al., (2010) described water desorption of sago chickpea and Moreira et al., (2008) studied water absorption of chestnuts. Water absorption process of many starchy and oily kernels was investigated by Abu-Ghannam and McKenna, (1997) and Gowen et al., (2007). In evaluating water absorption by dried palm nut, it is necessary to standardize the rate of absorption by determining the rate with respect to unit area of the nut since it has various sizes irrespective of the variety. Hence, the developed model would be useful in describing the rate of water absorption process per unit area of the dried palm nut in a given time during soaking at room temperature, and by extension used to predict moisture content of this soaked nut THEORY For drying of palm nuts, the moisture content (MC) can be expressed as ( Antia et al., 2014): % MC (wb) = % MC (db) = Where, wb denotes wet basis and db denotes dry basis. For absorption, the moisture content (MC) based on (9) and (10) can be expressed as: % MC (db) = (17) (18) (19) (20) Where, It is assumed that the water absorption per unit area per unit time of absorption is proportional to the change in mass of the nut per unit area per unit time; and can now be written based on (20) as: α = the area of the nut (mm2) (21) The area ( ) of nut is obtained as: 100 (9) = (22) 100 (10) Where, GMD = x = geometric mean diameter of the nut (mm) = = Volume of nut (mm3) and 100 (11) Where, axis. The volume of palm nut is given ( Antia and Assian, 2018) as: = a where, a and b are constants with values of 76.548 and 0.196 respectively for the nut. Let’s denote the water absorption per unit area as: = minor axis, = intermediate axis and = major % MC (wb) = 100 (12) Equations (11) and (12) can also be written respectively as: % MC (db) = (23) 100 (13) % MC (wb) = 100 (14) @ IJTSRD | Unique Paper ID - IJTSRD23471 | Volume – 3 | Issue – 3 | Mar-Apr 2019 Page: 1500
International Journal of Trend in Scientific Research and Development (IJTSRD) @ www.ijtsrd.com eISSN: 2456-6470 Subscript i= initial and f= final. = K ( ) = (24) (42) (43) (44) Let’s denote the initial mass of nut per unit area (dry bone mass per unit area) as: = ( K ( (25) is the mass of water absorbed per unit area of the nut in a given time; and ranges from minimum to maximum possible moisture content of the nut. But, from (34), the water absorbed per unit area of the nut is proportional to the difference between the nut mass per unit area at dry bone and mass per unit area at any time, t during absorption. This is expressed mathematically as: α Hence, from (44) = Q Where, Q is the proportionality constant that relates to the moisture content that is possible in the nut at a given time during absorption. A plot of against a slope equal Q Based on (13), (14), (18), (25), (26) and (46) % MC (db) = Let’s denote the final mass of nut per unit area at a given time during soaking as: = (26) Note that for absorption, the initial mass is the dry bone mass per unit area; as against for drying, the initial mass in this context is the mass per unit area at a given time. Equations (21), (24), (25) and (26) can also be written as: α (45) (27) (46) = ) (28) Where, = water absorption proportionality constant = (k Where, K = water absorption rate constant. Equation (26) becomes = K = K = K = K But, from (18), (24), (25) and (26) = From (33) and (34) = The power to which the water absorption is raised is not known, hence denoted as n and can be expressed based on (35) as: = From (15) and (35), rate of water absorption ( ) is given as: = Thus, (36) and (37) can be re-written as: = = The order of absorption is necessary to be known; hence (38) can be re-written as: = log (-K) A plot of log against log intercept as log (-K) From (36) and (38) = K dt ) (29) would give 100 (47) ) ) t ) dt ) (30) (31) (32) (33) = 100 (48) % MC (wb) = 100 (49) = 100 (50) METHOD The Dura and the Tenera varieties of palm nut were obtained from an oil processing mill and moisture content determined. For each variety, grizzly screen was used to classify the nuts, based on nut minor axis ranges namely: small size range range ) and large size range mm). Exactly three hundred nuts per size range per variety were randomly selected; and re-dried in a hot air convection oven at 105 0C to dry bone mass (ASAE, 2000; Aviara et al., 2005). The nuts were removed, kept in desiccators for five minutes and thereafter packaged per size range per variety into six polyethene bags. For a particular size range, 10 nuts were randomly picked from the polyethene bags, weighed using electronic weighing balance as taken using vernier calipers, numbered with permanent marker and then mixed together to have 20 nuts as a fair representation of mixed nut variety for that size range to be used for each experimental run. Each experiment was carried out in three replicates, and total number of nuts used was 1800. To study the water absorption per unit area of the dried palm nuts, each size range of the mixed nut variety was immersed respectively into three different vessels containing water at room temperature. At 3 hourly interval, twenty nuts were removed, weighed and readings recorded as . The moisture content of the nuts at the 3-hourly intervals was computed. Models for the rate of absorption per unit area and percentage moisture content were developed. The goodness of fit for the models carried out using statistical computation and analysis (Frank and Altheon, 1995; Spiegel and Stephens, 2006; Arumuganathan (34) (35) ), into three size , medium size 17 (36) (37) , axial dimensions (38) n log (39) gives the slope as n and (40) = K = (41) @ IJTSRD | Unique Paper ID - IJTSRD23471 | Volume – 3 | Issue – 3 | Mar-Apr 2019 Page: 1501
International Journal of Trend in Scientific Research and Development (IJTSRD) @ www.ijtsrd.com eISSN: 2456-6470 et al., 2009; Dermir et al., 2004: Antia and Assian, 2018). The models were tested using different sets of nuts. RESULTS AND DISCUSSION The data generated from the study of water absorption per unit area of dried palm nuts at a given time when soaked is presented in Fig. (1). Between 3 – 9 hours, the bulk nut samples showed a rapid falling rate period. This might be due to slow rate of water diffusion from the shell periphery to saturate the interior part of the shell. Between 9 - 21 hours, there was a fairly constant rate of water absorption of 0.0001 g H2O per mm2 per hr. At this point, the nuts might have reached moisture saturation point. However, it is suggested that the nut absorption capacity might be influenced among other things by its size, area, and thickness. Generally, it was observed that nuts water absorption rate per unit area curves resemble that of drying rate curves. It may therefore, be suggested that for drying and absorption, (46) can be written as: = Where negative sign is for desorption/drying and positive sign for absorption processes. More so, a plot of % moisture content (wb) versus time of absorption was carried out as presented in Fig. (3). (51) Fig. 1: A plot of amount of water absorbed per unit area against soaking time. From Fig. (1), three (3) regimes are observed, namely: rapid intake, gradual intake and fairly constant intake of water regimes. The rapid intake of water by the nuts occurred between 0 and 3 hours. At this period, water diffusion rate per unit area of the nuts was faster and primarily caused by concentration gradient. The gradient tends to move the water molecules to equalize the nut inner concentration. As the soaking time increased, the spores in the shell are to be filled with water. This results in a gradual rate of water intake per unit area between 3 – 12 hours. Beyond this period, almost a fairly constant amount of water intake was observed for the nuts. This might be as a result of the shell spores being saturated with water up to 0.0021 g H20 per mm2 per hr at 21 hours. However, the bulk sample data were computed and terminated at 21 hours since there were no data for the small size nut beyond this time due to reaching maximum possible water that can be absorbed by these nuts size. A plot of the rate of water absorption against time of absorption is presented in Fig.(2). Fig.3: A plot of % moisture content against soaking time Fig. (3) has similar shape as Fig. (1) and so the explanation of the phenomenon would be the same as discussed for Fig.(1). From experimental data generated, a model for the rate of water absorption per unit area was developed based on (34), (38) and (39) as: = = K Where, K= 4.72 × and n = 1.244 Usually, based on Arrhenius Equation, the K values may vary with temperature of the soaking medium. However, a plot of experimental and predicted values of rate of water absorbed per unit area of nut in a given time at room temperature using (52) was carried out on the bulk samples as shown in Fig.(4); and other statistical analysis result are presented in Table 1. (52) Fig. 2: Plot of rate of water absorbed per unit area against soaking time for the bulk sample. From Fig.(2), three (3) regimes are predominant, namely: rapid rising, rapid falling and fairly constant rate regimes. However, it was observed that the rate of water absorption per unit area increased rapidly between 0 – 3 hours. Fig. 4: Plot of predicted values against experimental values of rate of water absorbed per unit area for the bulk sample. @ IJTSRD | Unique Paper ID - IJTSRD23471 | Volume – 3 | Issue – 3 | Mar-Apr 2019 Page: 1502
International Journal of Trend in Scientific Research and Development (IJTSRD) @ www.ijtsrd.com eISSN: 2456-6470 TABLE 1: STATISTICAL PARAMETERS FOR GOODNESS OF FITFOR MODEL (52). Parameters TABLE 3: EXPERIMENTAL AND PREDICTED VALUES OF THE RATE OF WATER ABSORBED PER UNIT AREA AT A GIVEN TIME ( g H20 PER MM2 PER HR) AND % MOISTURE CONTENT (db). Values Coefficient of correlation, r 0.9955 Coefficient of determination, R2 0.9910 Reduced Chi-square, 0.00000 Mean bias error, MBE 0.00000 Root mean square error, RMSE 0.00001 More so, in predicting the moisture content at a given time, the value of Q in (48) was obtained as the slope from a plot using (46). This Q value is 0.706 ). The model developed based on (48) using the obtained values of K, n and Q is given as: % MC (db) = (i.e. (Standard deviation for (52) and (53) are 0.179 respectively) (Standard error for (52) and (53) are 2.1× 10⁻⁶ and 0.063 respectively) PRACTICAL APPLICATION The models developed were tested and found to be useful in predicting the range of moisture content suitable to crack dried nuts to release high percentage of whole kernels when appropriate impact energy is applied. CONCLUSION The models (48), (50) and (51) via (52) and (53) could be used to describe the water absorption process per unit area of nut in a given time; and also in predicting moisture content of bone dry bone mass of nut in a given time soaked in water at room temperature. REFERENCES [1]N. Abu-Ghannam, and B. Mc Kenna, “Hydration kinetics of kidney beans (Phaseolus vulgaris L.),” Journal of Food Science, 62 (3), pp.520–523, 1997. 5.9 × 10⁻⁶ and 100) (53) The plot of predicted and experimental values of the moisture content for the bulk sample is given in Fig. (5) and statistical analysis for goodness of fit is presented in Table 2. Fig. 5: Plot of predicted values against experimental values of % moisture content (wb) for the bulk sample. TABLE 2: STATISTICAL PARAMETERS FOR GOODNESS OF FIT FOR MODEL (50). Parameters [2]O. Antia, O. Kessington, E. Aluyor, and P. Ebunilo “Study of moisture content dynamic of fresh palm nuts during drying,” International Journal of Engineering Science Invention, 3 (2), pp.19-23, 2014. Values [3]O. Antia and U. Assian, “Development of an empirical model for palm nut volumeDetermination,” European Journal of Advances in Engineering and Technology, Vol. 5, (7), pp.466-469, 2018. Coefficient of correlation, r 0.9985 Coefficient of determination, R2 Reduced Chi-square, 0.9970 -0.0120 [4]T. Arumuganathan, M. R. Manikatan, R. D. Rai, S. Ananda, and V. Khare, “Mathematical modeling of drying kinetics of milky mush room in a fluidized bed dryer,” International Agrophysics, 23, pp.1-7, 2009. Mean bias error, MBE -0.0080 Root mean square error, RMSE 0.1570 Generally, from Fig. (4) and (5), the line for the slope equal one is the one for which predicted values is expected to be equal to experimental values. From Tables 1 and 2, the correlation coefficient, r may be approximated to R2. The values of R2 were higher than , MBE and RMSE. These are characteristics of good quality fit. To validate the model for rate of water absorption per unit area of dried palm nut, (52) was used in predicting the rate of water absorption per unit area of the nut in a given time at room temperature using different sets of nuts; while (53) was used for % moisture content estimation. The results are presented in Table 3. [5]ASAE (American Society of Agricultural Engineers), ASAE Standard Year Book, 345p, 2005. [6]N. A. Aviara, F. A. Oluwote, and M. A. Haque, “Effect of moisture content on some physical properties of sheanut,” International Agrophysics, (19), 193-198, 2005. [7]M. Bello, M. P Tolaba, R. J. Aguerre, and C. Suarez, “Modeling water uptake in a cereal grain during soaking,” Journal of Food Engineering, 97 (1), pp.95– 100, 2010. @ IJTSRD | Unique Paper ID - IJTSRD23471 | Volume – 3 | Issue – 3 | Mar-Apr 2019 Page: 1503
International Journal of Trend in Scientific Research and Development (IJTSRD) @ www.ijtsrd.com eISSN: 2456-6470 [8]O. Corzo, N. Bracho, and J. Rodrı´guez, “Comparison of Peleg and Azuara models in the modeling mass transfer during pile salting of goat sheets,” LWT – Food Science Technology. 46 (2), pp.448–452, 2012. dried chestnuts during rehydration,” Journal of Food Engineering, 86 (4), pp. 584–594, 2008. [18]L. Oliveira, B.G. Colnaghi, E. Z. Silva, I. R. Gouve, R. L. Vieira, and P. E. Augusto, “Modelling the effect of temperature on the hydration kinetic of adzuki beans (Vigna angularis),” Journal of Food Engineering, 118 (4), pp. 417–420, 2013. [9]V. Demir, T. Gunhan, A. K. Vagciogiu, and A.I. Degirmencioglu, “Mathematical determination of some quality parameters of air-dried bay leaves,” Biosystem Engineering, 18, pp.325-335, 2004. modeling and [19]M. Pilosof, R. Boquet, and G. B. Bartholomai, “Kinetics of water uptake by food powders,” Journal of Food Science, 50, pp. 278–282, 1985. [10]H. Frank, and S.C. Althoen, Statistics-Concept and Applications, Cambridge University Press, 1995, pp.127-129. [20]K. Prasad, P.R. Vairagar, and M. B. Bera, “Temperature dependent hydration kinetics of Cicer arietinum splits,” Food Research International, 43 (2), pp. 483–488, 2010. [11]A. Gowen, A. Abu-Ghannam, J. Frias, and J. Oliveira, “Influence of pre-blanching on the water absorption kinetics of soybeans,” Journal of Food Engineering, 78 (3), pp. 965–971, 2007. [21]S. M. Shafaei, and A. A. Masoumi, “Application of Visco- Elastic Model in the Bean Soaking” International Conference on Agricultural Engineering: New Technologies for Sustainable Agricultural Production and Food Security, Sultan Qaboos University, Muscat, Oman, 2013a. [12]V. A. Jideani, and S. M. Mpotokwana, “ Modeling of water absorption of Botswana Bambara varieties using Peleg’s equation,” Journal Food of Engineering, 92 (2), pp. 182–188, 2009. [13]M. Kashaninejad, A. M. Dehghan, and M. Khashiri, “Modeling of wheat soaking using two artificial neural networks (MLP and RBF),” Journal of Food Engineering, 91 (4), pp. 602–607, 2009. [22]S. M. Shafaei, and A. A. Masoumi, “Evaluation of Khazaei model in predicting of water absorption of chickpea during soaking,” Agricultural Advances, 3 (1), pp. 1–8, 2014b. [14]M. Kashaninejad, Y. Maghsoudlou, S. Rafiee, and M. Khomeiri, “Study of hydration kinetics and density changes of rice (Tarom Mahali) during hydrothermal processing,” Journal of Food Engineering,79 (4), 1383– 1390, 2007. [23]S. M. Shafaei, and A. A. Masoumi, “Studying and modeling of hydration kinetics in chickpea seeds (Cicer arietinum L.),” Agricultural Communications Journal, 2 (2): 15–21, 2014c. [24]B .P. Singh, and S.P. Kulshrestha, “Kinetics of water sorption by soybean and pigeon pea grains,” Journal of Food Science, 52, pp. 1538–1544, 1987. [15]K. H. Mc Watters, M. S. Chinnan, R.D. Phillips, L. R. Beuchat., L. B. Reid, and R. M. Mensa-Wilmot, “Functional, nutritional, mycological and akara-making properties of stored cowpea meal,” Journal of Food Science, 67 (6), 2229–2234, 2002. [25]M. R. Spiengel, and L. J. Stephens, Statistics. Schaum’s Outline Series. 3rd Edition. McGraw- Hill Companies, New York, 1999, 362-401, 281-286. [16]F. D. Montanuci, L. M. Jorge, and R. M. Jorge, “Kinetic, thermodynamic properties, and optimization of barley hydration,” Food Science Technology (Campinas), 33 (4), pp. 690–698, 2013. [26]M. Turhan, S. Sayar, S. Gunasekaran, “Application of Peleg model to study water absorption in chickpea during soaking,” Journal Food Engineering, 53 (2), pp. 153–159, 2002. [17]R. Moreira, F. Chenlo, L. Chaguri, and C. Fernandes, “Water absorption, texture, and colour kinetics of air- @ IJTSRD | Unique Paper ID - IJTSRD23471 | Volume – 3 | Issue – 3 | Mar-Apr 2019 Page: 1504