Download
1 / 10
100 likes | 104 Views
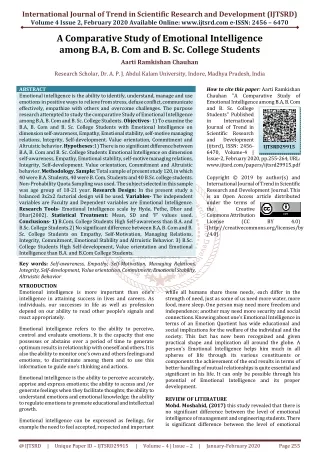
Emotional Intelligence EI has emerged as the most influencing concept contributing more vibrantly to one's productivity and success in life than Intelligence Quotient. Its influence on and relevance in various fields like leadership, relationships, individual success is being scientifically researched and asserted. As long as the broader mission of education is to prepare students for positions of responsibility and leadership and make them industry ready, there is a need for institutions to invest in emotional development of students. Professional courses like medical and engineering are highly stressful. Overwhelming burden may cause huge stress on the students pursuing these courses. Developing right Emotional Intelligence and itscorrect measurement is very essential, hence EI variables have to be studied in depth among the students. This study is at the preliminary stage, the primary goal is to explore the relationship between EI, Coping stress and Academic performance. After making a systematic understanding of models and measures of EI, the authors have chosen Shutte's Emotional Intelligence SSEIT scale, as this inventory has been widely used by many researchers on various target respondents especially on the college students. The sample consisted of 1120 engineering college students from engineering colleges of D.K district, Karnataka. The data has been collected using stratified purposive sampling method. This study is an analysis of 33 variables associated with various facet of EI. Utilizing Exploratory Factor Analysis EFA techniques, the researchers examined the relationships among the different variables present in SSEIT. Components were extracted using Principal Components Analysis PCA and used varimax rotation resulting in nine component solution. Sangita Biswas | Dr. Surekha Invalli "A Snooping on the Factor Structure of Schutte Self-Report Emotional Intelligence Test among the Engineering Students" Published in International Journal of Trend in Scientific Research and Development (ijtsrd), ISSN: 2456-6470, Volume-2 | Issue-1 , December 2017, URL: https://www.ijtsrd.com/papers/ijtsrd8268.pdf Paper URL: http://www.ijtsrd.com/management/research-method/8268/a-snooping-on-the-factor-structure-of-schutte-self-report--emotional-intelligence-test-among-the-engineering-students/sangita-biswas<br>

E N D
International Research Research and Development (IJTSRD) International Open Access Journal International Open Access Journal International Journal of Trend in Scientific Scientific (IJTSRD) ISSN No: 2456 - 6470 | www.ijtsrd.com | Volume he Factor Structure of Schutte Self ISSN No: 2456 | www.ijtsrd.com | Volume - 2 | Issue – 1 A Snooping on the Factor Structure Emotional Intelligence Test Emotional Intelligence Test among the Engineering Students among the Engineering Students f Schutte Self-Report Sangita Biswas Department of Management Studies, KVG College of Engineering, Dr. Surekha Invalli Surekha Invalli Head, Department of Management Studies, KVG College of Engineering, , Karnataka Research Scholar, Department of Management Studies, KVG College of Engineering, Sullia, Karnataka Professor & Head, Department of Management Studies, KVG College of Engineering, Sullia, Karnataka ABSTRACT Emotional Intelligence (EI) has emerged as the most influencing concept contributing more vibrantly to one’s productivity and success in life than Intelligence Quotient. Its influence on and relevance in various fields like leadership, relationships, indiv is being scientifically researched and asserted. As long as the broader mission of education is to prepare students for positions of responsibility and leadership and make them industry-ready, there is a need for institutions to invest in emotional development of students. Professional courses like medical and engineering are highly stressful. Overwhelming burden may cause huge stress on the students pursuing these courses. Developing right Emotional Intelligence and itscorrect measurement is very essential, hence EI variables have to be studied in depth among the students. This study is at the preliminary stage, the primary goal is to explore the relationship between EI, Coping stress and Academic performance. After making a systematic understanding of models and measures of EI, the authors have chosen Shutte’s Emotional Intelligence (SSEIT) scale, as this inventory has been widely used by many researchers on various target respondents especially on the college students. The sample consisted of 1120 engineering college students from engineering colleges of D.K district, Karnataka. The data has been collected using stratified purposive sampling method. This study is an analysis of 33 variables associated with various facet of EI. Utilizing Exploratory Factor techniques, the researchers examined the relationships among the different variables present in SSEIT. among the different variables present in SSEIT. Emotional Intelligence (EI) has emerged as the most influencing concept contributing more vibrantly to one’s productivity and success in life than Intelligence Quotient. Its influence on and relevance in various fields like leadership, relationships, individual success is being scientifically researched and asserted. As long as the broader mission of education is to prepare students for positions of responsibility and leadership ready, there is a need for Components Components Analysis (PCA) and used varimax rotation resulting in nine component solution. Components Components Analysis (PCA) and used varimax rotation resulting in nine component sol Keywords: Emotional Intelligence, SSEIT, Exploratory Factor Analysis Introduction: were were extracted extracted using using Principal Principal : Emotional Intelligence, SSEIT, Exploratory Emotional intelligence (EI) has drawn huge attention since its introduction. It was originally proposed by Salovey and Mayer (1990) defined as an "ability to monitor one's own and others' feelings and emotions, to discriminate among them and to use this information to guide one's thinking and actions". A related definition says "ability to adaptively recognize emotion, express emotion, regulate emotion and harn (Schutte et al., 1998).Previous studies suggest that non traditional measures of intelligence, such as emotional intelligence may be better predictors of success than traditional psychometric IQ tests and other standardized measures of academic achievement (Goleman, 1998; Dryden & Vos, 1994). In the current competitive world students of professional courses always face different kinds of stress. An optimal stress is required for their learning process but excess stress lead them to depression anxiety mental and physical health hazards, so it is very essential to develop and measure their right emotional intelligence to deal with unseen complexities of life and improve the quality of education. of life and improve the quality of education. Emotional intelligence (EI) has drawn huge attention since its introduction. It was originally proposed by Salovey and Mayer (1990) defined as an "ability to monitor one's own and others' feelings and emotions, to discriminate among them and to use this information to guide one's thinking and actions". A related definition says "ability to adaptively recognize emotion, express emotion, regulate emotion and harness emotions" (Schutte et al., 1998).Previous studies suggest that non- traditional measures of intelligence, such as emotional intelligence may be better predictors of success than traditional psychometric IQ tests and other standardized ic achievement (Goleman, 1998; Dryden & Vos, 1994). In the current competitive world students of professional courses always face different kinds of stress. An optimal stress is required for their learning process but excess stress lead them to anxiety mental and physical health hazards, so it is very essential to develop and measure their right emotional intelligence to deal with unseen complexities tional development of students. Professional courses like medical and engineering are highly stressful. Overwhelming burden may cause huge stress on the students pursuing these courses. Developing right Emotional Intelligence and very essential, hence EI variables have to be studied in depth among the students. This study is at the preliminary stage, the primary goal is to explore the relationship between EI, Coping stress and Academic performance. After anding of models and measures of EI, the authors have chosen Shutte’s Emotional Intelligence (SSEIT) scale, as this inventory has been widely used by many researchers on various target respondents especially on the college students. 1120 engineering college students from engineering colleges of D.K district, using stratified purposive sampling method. This study is an analysis of 33 variables associated with various facet of EI. atory Factor techniques, the researchers examined the relationships Analysis Analysis (EFA) (EFA) @ IJTSRD | Available Online @ www.ijtsrd.com @ IJTSRD | Available Online @ www.ijtsrd.com | Volume – 2 | Issue – 1 | Nov-Dec 2017 Dec 2017 Page: 1433
International Journal of Trend in Scientific Research and Development (IJTSRD) ISSN: 2456-6470 Background: Thrust on determining emotional intelligence in education EI Measurement Tools developed in India 1.Dr. Dalip Singh & Dr. NK Chadha Tool: Dalip Singh (2003) defines Emotional intelligence as “the ability of an individual to appropriately and successfully respond to a vast variety of emotional stimuli being elicited from the inner self and immediate environment”.Dr. Dalip Singh & Dr. NK Chadha developed an EI scale which consists of three psychological dimensions.1.emotional competency, 2.emotional maturity and 3.emotional sensitivity, which motivate an individual to recognize truthfully, interpret honesty and handle tactfully the dynamics of human behavior. This test has been standardized for professional managers, businessmen, bureaucrats, artists, graduate student, and adolescent population. One has to respond to each of the 22 different situations given in the scale. There is a scoring key provided by the Developer. 2.Anukool Hyde, Sanjyot Pethe, Upinder Dhar Tool (2002) The trios have developed a tool to measure Emotional Intelligence. It is a 34 item EI scale, covers 10 factors designated by specific item numbers.1.Self-Awareness, 2.Empathy, 3.Self-Motivation, 4.EmotionalStability, 5.Managing Relation, development,8.Value 10.Altruistic behavior. 3.Emotional Intelligence Inventory EII-MM Emotional Intelligence Inventory Constructed, developed S.K.Mangal and Shubra Mangal.The inventory covers 4 major areas of EI such as Intra-personal awareness, Inter-personal awareness, Intra-personal management and Inter-personal management.It has 100 items, equally distributed in all four areas(25 questions in each area).It is a dichotomous scale to be answered in either yes or no. The validity of the scale has been established by two different approaches such as factorial and criterion related approach. 4.Deepa Raghunath Emotional Intelligence Tool(DKEIT) DeepaRaghunath and R. Krishnaveni (2008) developed an Emotional Intelligence scale considering the Indian culture and context. The scale consists of three important construct obtained from the definition of Emotional Intelligence 1.Emotional Perception, 2. Emotional Appraisal, 3. Emotional Regulation. The sub Many researchers differentiate between trait EI and ability EI. Trait EI refers to self-reported emotion- related dispositions and ability EI represents cognitive emotional abilities measured through maximum- performance tests (Pérez, 2005).Till date, several measurements have invented to assess trait EI, such as Trait Emotional Intelligence Questionnaire (TEIQue; Petrides, Perez, &Furnham, 2003), BarOn Emotional Quotient Inventory (EQ-I; Bar-On, 1997),Emotional Competence Inventory (ECI; Boyatzis & Goleman, 1999), and among them, Schutte Self-Report Emotional Intelligence (SSEIT) has been extensively used in the literature for its brevity and availability in the public domain (Pérez et al., 2005). Petrides, &Furnham, There are several papers to examine the psychometric properties of SSEIT’s, but its factor structure remains inconsistent and unclear, ranging from three to five factors (Pérez et al., 2005),also six factors(Ginac et al 2005) later reduced to 4 factors and showed similarity with 4 factor solution of Petrides, Furnham,(2000) & Austin, Minski (2003) and all with an international sample (e.g., Australians in Gignac, Palmer, Manocha, &Stough, 2005);Canadians in Austin, Saklofske, Huang, &McKenney, 2004).A study by Ibraheem Dooba on African sample resulted an eight factor solution. A study by Dr. R Angayarkanni and Mr.Anand Shankar Raja (2016) on Indian Mystery Shoppers resulted in a nine factor solution but factor names were not mentioned. The various EI measures, based on different models are complementary to one another (Pérez et al., 2005), and research showed that when different measures of trait EI were included, they each uniquely predicted academic achievement (Di Fabio & Palazzeschi, 2015), career decision making (Di Fabio &Saklofske, 2014a), and psychological outcomes (Di Fabio &Saklofske, 2014b). An empirical study by Rama Devi. V and Lakshmi Narayanamma(2014)came up with the findings that academic performance of Engineering students is independent of factors of emotional intelligence. They employed EI tool developed by Schutte et.al on a sample of 177 students. Initially 12 factors explaining 61.44% of variance were extracted, after subjecting to MonteCarlo parallel analysis, only 5 factors were retained. Based on factor analysis 32 components are categorized into five factors-Emotional Management, Awareness, Negative outlook, Non-verbal messages and Positive outlook. 6.Integrity, orientation,9.Commitment 7.Self- EII-MM(2004) standardised and by and R. Krishnaveni @ IJTSRD | Available Online @ www.ijtsrd.com | Volume – 2 | Issue – 1 | Nov-Dec 2017 Page: 1434
International Journal of Trend in Scientific Research and Development (IJTSRD) ISSN: 2456-6470 components under Emotional Perception are 1. Perceiving Emotion in faces, Puctures, Music, Paralanguage, Gesture, Colours, narration, Emotional Appraisal has two sub components. Appraisal of self- emotions and other’s emotions. Emotional Regulation has two sub components.1. Regulating self behaviour,2. Regulating others’ behavior. Cronbach alpha values for subscales, content and construct validity indices were quite satisfactory. SSEIT: Schutte Emotional Intelligence Scale, Schutte Self- Report Emotional Intelligence Test, or Assessing Emotions Scale is based on Salovey and Mayer’s (1990) model that includes three aspects of EI: appraisal and expression of emotion (self and other), regulation of emotion (self and other), and utilization of emotion (flexible planning, creative thinking, redirected attention, and motivation).According to the Salove Mayer(1990)The first category was further subdivided into verbal and non-verbal and the non-verbal is again subdivided to perception and empathy. In 2004 Mayer Salovey and Caruso have refined their 1990 model into four structure model(Perception, Facilitation, Understanding employing emotion) but basic aspects of EI remains the same. Based on the three factor model of Salovey and Mayer (1990), Schutte et.al. (1998) have designed the Self Report Emotional Intelligence scale which is also called as Schutte Self Report Emotional Intelligence Scale (SSEIT).The study was conducted consisting of 62 items, based on the Salovey and Mayer (1990)’s theoretical three factor model of emotional intelligence shortlisted after a rigorous pilot test. These 62 items were administered to 346 participants of United States in a five point scale where ‘1’ represented ‘strongly disagree’ and ‘5’ represented ‘strongly agree’. From the responses collected, out of the 62 items 33 items loaded on a single factor with loadings 0.4 and above. So they redesigned the scale with 33 items among which 3 items were reverse scored. The test – retest reliability (0.78), internal consistency (Cronbach’s alpha 0.87) predictive validity (predicted grade point average in school students r = 0.32, p <0.01), and discriminant validity (with Big Five personality traits) of the scale has been checked by them and reported to be stable and acceptable.(Arunachalam ,Palanichamy,2017). Arguments in favour of SSEIT: SSEIT is one of the few inventories available for the public and widely used for the research domain across countries. (Naeem and Muijtjens, 2015; Tharbe, Mun and Sumari, 2015).The published version of SSEIT includes items from all the broad dimensions of Salovey Mayer’s (1990) model of EI (Schutte et al.,1998).This inventory was tested on respondentswith high levels of optimism and life satisfaction, low depression, pessimism, and alexithymia. It was predictive of first-year college students’ grade point average (GPA), and was unrelated to cognitive ability and most aspects of personality (Schutte et al., 1998; Schutte&Malouff, 2011).SSEIT gives some advantages on scoring, reliability, and emphasis on typical performance when compared to other measures of EI (Gignac et al, 2005). Criticism about SSEIT: Schutte et al.’s (1998) analysis has been criticized for several reasons. First, the use of orthogonal rotation after a principal component analysis was a “little Jiffy” (Petrides&Furnham, 2000, p. 314), and they should have used oblique rotation, which allows for intercorrelation among factors (Gignac et al., 2005). The author have used the principal component orthogonal – rotation factor analysis in extracting the 33 items which had 0.4 and above loadings which is a stringent criterion in deciding factor loading (Gignac et al., 2005).By using an exploratory factor analysis alone they concluded the factor structure of the 33 items as uni-dimensional and retained only one of the four factors to achieve a conceptual parsimony, yet they claimed that the factor reflected three dimensions of Salovey and Mayer’s (1990) model. They argued that after the factor analysis, roughly equal number of items on the three factors of emotional intelligence could be evolved, emotional intelligence could also be considered as homogeneous in nature. All the 62 items with which the analysis was started and their argument of three factor model of emotional intelligence focuses on the three distinct factors which makes emotional intelligence as a latent construct. Finally they concluded the one factor solution for SSEIT resulted in three different sub categories, have also not confirmed by Confirmatory Factor Analysis CFA, but further analysis on the factor structure of SSEIT has been guaranteed. (Arunachalam, Palanichamy, 2017) Factor structure of SSEIT: The factor structure of SSEIT was analysed by various researchers ever since its development. Many contradictory results also evolved during the analysing process. The one-dimensional structure was reported by Schutte et.al.,(1998),Three dimensional structure was reported by Naeem and dimensional structure was reported by Petrides and Furnham(2000) and Saklofske, Minski(2003).The five dimensional structure was Emotional and Analyzing and Muijtjens,(2015),Four Austin and @ IJTSRD | Available Online @ www.ijtsrd.com | Volume – 2 | Issue – 1 | Nov-Dec 2017 Page: 1435
International Journal of Trend in Scientific Research and Development (IJTSRD) ISSN: 2456-6470 converged to a single construct of Emotional Intelligence reported by Ng et al.,(2010),and Gong and Paulson,(2016).The six dimensional structure was reported by Gignac et al (2005).The factor structure obtained by Petrides and Furnham(2003) closely authenticated the result of Sakelofske, Austin and Minski(2003).Eight dimension was proposed by IbraheemDooba (2009) and nine dimension was proposed by Dr.RAngayarkanni and Mr.Anand Shankar Raja(2016) Present Study: Even though most of the studies reported four factor structures, the items underlying each factor are different. The present study tries to evolve the factor structure using Exploratory Factor Analysis (EFA) on the engineering students. Method: Sample Respondents: The study was conducted among 1120engineering students from six different Private Engineering colleges across Dakshina Kannada district. The region is divided into 5 taluks, one engineering college from each taluk was chosen for the study. Two colleges were chosen from Mangalore taluk, considering the availability of more number of engineering colleges in that particular taluk. Researcher sought the Permission from the Principals to meet the students of First year and Final year. The data was collected in the presence of researcher in case of First year students, while the Head of the Departments willingly agreed to distribute and collect the responses from Final year students. Profile of the respondents: Totally 1120 students of mean age 20.13±1.85 years participated in this study. Among all the students 498 are female and 622 are male. The female students consist of 48.90 percent from the first year and 40.28 percent from the final year whereas the male students consist of 51.10 percent from the first year and 59.72 percent from the final year. There are 65 percent respondents from circuit branch and 35 percent respondents from non-circuit branch. Approximately 80 percent respondents are Hindu, 13 percent are Christian,6 percent are Muslims and rest belong to the other religion. 44 percent students belong to rural, 16 percent students belong to semi urban and almost 39 percent respondents belong to urban population. Table-1 provides the information about the student profile in detail. Table 1: Profile of the respondents n (%) All 20.13(1.85) First year 18.43(.67) Final year 21.72 (.95) Age, (SD) Gender Female Male Total Religion Hindu Christian Muslim Other Total Branch circuit non circuit Total Locality Rural semi urban urban other Total mean 498(44.46) 622(55.54) 1120(100.00) 266(48.90) 278(51.10) 544(100.00) 232(40.28) 344(59.72) 576(100.00) 902(80.54) 141(12.59) 70(6.25) 7(0.625) 1120(100.00) 435(79.96) 65(11.95) 40(7.35) 4(0.74) 544(100.00) 467(81.08) 76(13.19) 30(5.21) 3(0.52) 576(100.00) 726(64.82) 394(35.18) 1120(100.00) 361(66.36) 183(33.64) 544(100.00) 365(63.37) 211(36.63) 576(100.00) 496(44.29) 174(15.54) 441(39.38) 9(0.80) 1120(100.00) 246(45.22) 70(12.87) 221(40.63) 7(1.29) 544(100.00) 250(43.40) 104(18.06) 220(38.19) 2(0.35) 576(100.00) @ IJTSRD | Available Online @ www.ijtsrd.com | Volume – 2 | Issue – 1 | Nov-Dec 2017 Page: 1436
International Journal of Trend in Scientific Research and Development (IJTSRD) ISSN: 2456-6470 Tool: Schutte Self Report Emotional Intelligence scale (SSEIT, 1998) was used for the study. The scale consisting of 33 items among which 3 negative items (5, 28 and33) were reverse scored. The responses were accumulated on a five point Likert scale. Exploratory Factor Analysis(EFA) of SSEIT: the data was exposed to Exploratory Factor Analysis. Regarding the communalities, .8 or greater it is well accepted says Velicer and Fava (1998), and it was also mentioned that this rarely occurs in real data most common magnitudes in the social sciences are low to moderate communalities ranges between .40 to .70.If an item has a communality of less than .40,it may either a) not be related to the other items, or b) suggest an additional factor that should be explored. The Extraction Sums of Squared Loadings is identical to the Initial Eigenvalues. KMO values greater than 0.8 can be considered well, i.e. an indication that component or factor analysis will be useful for these variables. In this research the KMO value is .886 which is very good and well accepted .According to the K1 - Kaiser’s (Kaiser 1960) method, only constructs which has the eigenvalues greater than one should be retained for interpretation. Prior studies by Fabrigar et al.,(1999);Mac Callum, Widaman,Zhang& Hong(1999).Thompson(2004) revealed that the main aim of Exploratory Factor analysis is reduction of number of factors or variables, that lies in the assessment of multicollinearity among factors which are correlated unidimensionality of construct evaluation and detection. So in this analysis Table 2: The exploratory factor analysis with principle component analysis and varimax rotation(SPSS-23) resulted in a 9 factor structure with 53.71% of the total variance and eigenvalues greater than 1.0 .The factor loadings above 0.4 had been extracted(Schutte et.al.,1998).All 33 item are loaded. Item 6 and 14 are cross loaded so, the factors under which these two items showed maximamvalue are considered. Item six is excluded from the study in order to increase the reliability of factor 6.Even though Petrides and Furnham(2000) reported the inclusion of all items in four factor structure, in this study 9 factors are extracted by inclusion of 32items and exclusion of one item. A loading is nothing but the Pearson correlation between the variable components.(Stevens, 2009).Greater is the loading more the variable is a pure measure of the component.(Tabachnick & Fidell, 2001).Rotated matrix of the component reveals an interpretable and simple solution. The factor’s name have been decided from the partial similarities observed in item loading under the factors described by Petrides and Furnham(2000) ,Saklofske, Austin and Minski(2003) and also KMO and Bartlett's Test Kaiser-Meyer-Olkin Measure of Sampling Adequacy. Bartlett's Test of Sphericity .886 8337.095 528 0.000 Approx. Chi-Square df Sig. discussing with English Language and Psychology experts. Table 3: represents the factor Emotional Utilization consists of 7 items with Eigen value is 7.009 and it accounts for 21.240 percentage of variance, Cronbach alpha is 0.747 which shows good internal consistency of the items. Table 4: has three statements representing Emotional Appraisal having Eigen Value 1.852,% of variance 5.613 and Cronbach alpha is 0.684 which is also very close to .70.Table5: represents the factor Optimism having Eigen value 1.524 and 4.619 percentage of variance. Factor 4 that is Emotional Control represented by Table6: beholding an Eigen value 1.487 and 4.505 percentage of variance. Table7: representing Social Skill with Eigen value 1.348 and representing 4.085percentage of variance. Table8: representing Non-verbal Interpretation consisting of two statements having Eigen value 1.196 and 3.624 percent of variance with a Cronbach alpha 0.620.Table 9: represents Emotional Awarenesswith 3.569 percentage of variance and 1.178 Eigen value. The factor Negative Outlook represented by Table 10: and the extracted @ IJTSRD | Available Online @ www.ijtsrd.com | Volume – 2 | Issue – 1 | Nov-Dec 2017 Page: 1437
International Journal of Trend in Scientific Research and Development (IJTSRD) ISSN: 2456-6470 having three statements, beholding Eigen value 1.098 with 3.329 percentage of variance. The ninth factor or Emotional Regulation is represented by Table 11: consisting of four questions having an Eigen value 1.031 and 3.125 percentage of variance and Cronbach alpha 0.654. TABLE : 3 EMOTIONAL UTILIZATION Loading Eigen Value S.No Statement % Variance of Cronbach alpha 1. When my mood changes, I see new possibilities(7) I expect good things to happen (10) When I am in a positive mood, solving problems is easy for me. (17) When I am in a positive mood, I am able to come up with new ideas(20) I motivate myself by imagining a good outcome to tasks I take on.(23) When I feel a change in emotions, I tend to come up with new ideas.(27) I use good moods to help myself keep trying in the face of obstacles.(31) .545 7.009 21.240 0.747 2. 3. .448 .610 4. .613 5. .476 6. .511 .498 TABLE 4: EMOTIONAL APPRAISAL Loading S.No Statement Eigen Value 1.852 % Variance 5.613 of Cronbach alpha 0.684 1. By looking at their facial expressions, I recognize the emotions people are experiencing.(18) I know what other people are feeling just by looking at them.(29) I can tell how people are feeling by listening to the tone of their voice.(32) .650 2. .753 3. .683 TABLE 5: OPTIMISM loading s. no statement Eigen value 1.524 % variance 4.619 of Cronbach alpha 0.600 1. I know when to speak about my personal problems to others.(1) When I am faced with obstacles, I remember times I faced similar obstacles and overcame them(2) I expect that I will do well on most things I try.(3) Other people find it easy to confide in me.(4) .537 2. .464 3. .488 4. .613 @ IJTSRD | Available Online @ www.ijtsrd.com | Volume – 2 | Issue – 1 | Nov-Dec 2017 Page: 1438
International Journal of Trend in Scientific Research and Development (IJTSRD) ISSN: 2456-6470 TABLE 6: EMOTIONAL CONTROL S.No Statement Loading Eigen Value 1.487 % Variance 4.505 of Cronbach alpha 0.622 1. 2. 3. I know why my emotions change.(19) I have control over my emotions. (21) I easily recognize my emotions as I experience them.(22) .575 .740 .581 TABLE 7: SOCIAL SKILL S.No Statement Loading Eigen Value 1.348 % Variance 4.085 of Cronbach alpha 0.620 1. I present myself in a way that makes a good impression on others. (16) I compliment others when they have done something well .(24) When another person tells me about an important event in his or her life, I almost feel as though I have experienced this event myself .(26) I help other people feel better when they are down(30) .426 2. .627 3. .618 .571 TABLE 8: NON VERBAL INTERPRETATION S.No Statement Loading Eigen Value 1.196 % Variance 3.624 of Cronbach alpha 0.662 1. I am aware of the non-verbal messages I send to others.(15) I am aware of the non-verbal messages other people send.(25) .762 2. .731 TABLE 9: EMOTIONAL AWARENESS S.No Statement Loading Eigen Value 1.178 % Variance 3.569 of Cronbach alpha 0.632 1. Emotions are one of the things that make my life worth living (8) .771 2. I am aware of my emotions as I experience them (9) .646 TABLE 10: NEGATIVE OUTLOOK S.No Statement Loading Eigen Value 1.098 % Variance 3.329 of Cronbach alpha 0.446 1. I find it hard to understand the non-verbal messages of other people*(5) When I am faced with a challenge, I give up because I believe I will fail*(28) It is difficult for me to understand why people feel the way they do*(33) .627 2. .638 3. .705 @ IJTSRD | Available Online @ www.ijtsrd.com | Volume – 2 | Issue – 1 | Nov-Dec 2017 Page: 1439
International Journal of Trend in Scientific Research and Development (IJTSRD) ISSN: 2456-6470 TABLE 11: EMOTIONAL REGULATION S.No Statement Loading Eigen Value 1.031 % Variance 3.125 of Cronbach alpha 0.654 1. I like to share my emotions with others.(11) .507 2. When I experience a positive emotion, I know how to make it last.(12) I arrange events others enjoy.(13) I seek out activities that make me happy.(14) .529 3. 4. .469 .446 The results shown in the Table 12: indicate that among the nine domains, Emotional Appraisal scores less, which reveals that there is a potential for the students to improving their level of emotions and self-confidence. Emotional Control and Emotional Regulation scores less which explains that students in between age group (18- 21) are poor dealing with emotional complexities but over the period of time they can improve. Non-verbal Interpretation also shows less score which narrates that students may not have enough maturity to interpret non- verbal messages easily. Negative Outlook lower shows the better Emotional Intelligence construct of the students. Table 12: Item loadings and mean score of different factors Name of the Factors Item loaded Emotional Utilization 7,10,17,20,23,27,31 18,29,32 Mean Score 4.1929 3.9592 Emotional Appraisal 1,2,3,4 19,21,22 16,24,26,30 15,25 8,9 5,28,33 11,12,13,14 Optimism Emotional Control Social Skill Non-verbal Interpretation Emotional awareness Negative outlook Emotional Regulation 4.1627 3.8824 4.1647 3.8116 4.2022 2.9607 3.8598 Limitations of the study: The respondents for the survey to develop the SSEIT Construct were a homogeneous group of 1120 participants from Engineering Studies in Dakshina Kannada District, Karnataka, India. The average age of the participants was 29.27 years in case of SSEIT,(Schutte et al. (1998), and in the present study most of the participants were between 18 to 22 age group. Students pursuing different branches of Engineering Studies, speaking different mother tongues such as Kannada, Tulu, Konkani, Malayalam etc. have taken part in this survey. The resulting nine -factor model of EI identified in this study contradicted the evidence found invariantly across South African, Canadian and British samples. The study was conducted in only one district therefore the findings cannot be generalized to other Engineering students of the same age throughout the country. Another important limitation is that assessment of EI varies from person to person based on his/her intelligence and also with assessment tools, especially with the self-assessment scales. (Schutte, N.S. & Malouff, J.M. 1998). Conclusion: Factor analysis is a method created to examine a set of variables which is related to the domain or domains under study. The main objective of EFA is to discover covariant relationships among a set of variables that can be reduced into distinct, meaningful factors or components for future analysis. A primary measure of an EFA’s validity is the emergence of a simple, interpretable structure. .Shuttle’s Emotional Intelligence scale is widely used by many researchers, to assess the level of Emotional Intelligence among various groups of people. In this research engineering college students being the target respondents are being exposed to the Shuttle’s EI scale which consists 33 item scale constructs representing various factors such as appraisal of own emotions , appraisal of others’ @ IJTSRD | Available Online @ www.ijtsrd.com | Volume – 2 | Issue – 1 | Nov-Dec 2017 Page: 1440
International Journal of Trend in Scientific Research and Development (IJTSRD) ISSN: 2456-6470 6.Boyatzis, R. E., & Goleman, D. (1999). Emotional Competence Inventory. Boston, MA: Hay/McBer Group. emotions , regulation of own emotions , regulation of others’ emotions, utilization of emotions . After running the EFA for this scale for engineering first and final year students the results clearly states that, optimism have a very strong association as it has been grouped component matrix and hence it is clear that this variable suits the Engineering college students have to be optimistic to overcome the educational and related stress and balance them in a positive way. Emotional Utilization helps the students to boost up their self-confidence to accept the challenges in professional courses and also to utilize their positive mood for a constructive outcome. Social Skills are one of the important characteristics engineering students must have to work along with the fellow mates from different cultural backgrounds, to help each other, to appreciate and also to get accepted for any kind of teamwork. Emotional awareness helps the students to keep away from unnecessary emotional complexities of life and lead to move in a positive direction. Reference: 7.Brackett, M. A., & Mayer, J. D. (2003). Convergent, discriminant, and incremental validity of competing measures of emotional intelligence. Personality and Social Psychology Bulletin, 29, 1147-1158. doi:10.1177/0146167203254596 respondent categories. 8.Deepa, R., Krishnaveni, R. (2008). Concepts and measures of emotional intelligence: A research perspective. Journal of Contemporary Research in Management, 69-84. 9.Di Fabio, A., & Saklofske, D. H. (2014a). Comparing ability and self-report trait emotional intelligence, fluid intelligence, and personality traits in career decision. Personality and Individual Differences, doi:10.1016/j.paid.2014.02.024 64, 174-178. 10.Di Fabio, A., & Saklofske, D. H. (2014b). Promoting individual resources: The challenge of trait emotional intelligence. Personality and Individual Differences, doi:10.1016/j.paid.2014.01.026 65, 19-23. 1.Ahmad Tharbe., I. H., Ng, K. M., & Sumari, M. (2015). Construction of a self-rated Malaysian emotional intelligence scale. Assessed from URL: http://eprints.um.edu.my/13900/1/Construction_of_ Self_Rated_Malaysian_Emotional_Intelligence_Sca le_(Jun_2015).pdf. 11.Di Fabio, A., & Palazzeschi, L. (2015). Beyond fluid intelligence and personality traits in scholastic success: Trait emotional intelligence. Learning and Individual Differences, 40, 121-126. doi:10.1016/j. lindif.2015.04.001 2.Angayarkanni, factor analysis on Schutte self-report emotional intelligence scale(SSREI) with reference to mystery shoppers.International Journal of Engineering Sciences & Management, 6(4),8-15 R.,Raja,A.S.(2016).Exploratory 12.Dooba, Ibraheem (2009) "Validation of an emotional intelligence scale: A case of an African sample,"Academic Leadership Article 38. Journal: 7(4), 13.Dryden, G., &Vos, J. (1994).The learning revolution. Winnipeg, Canada: Skills of Learning Publication. 3.Arunachalam T., Palanichamy Y.,(2017). An Investigation on the factor structure of Schutte self- report emotional intelligence test in Indian student sample.The International Psychology, 4(2), No. 94, 42-49. 14.Fabrigar, L. R., Wegener, D.T., MacCallum,R. C., & Strahan, E. J.(1999).Evaluating the use of exploratory factor analysis in psychological research. Psychological Methods, 4(3), 272-299. Journal of Indian 4.Austin, E. J., Saklofske, D. H., Huang, S. H., & McKenney, D. (2004). Measurement of trait emotional intelligence: Testing and cross-validating a modified version of Schutte et al.’s (1998) measure. Personality and Individual Differences, 36, 555-562. doi:10.1016/S0191-8869(03)00114-4 15.Gignac, G.E., Palmer, B.R., Manocha, R., & Stough, C. (2005). An examination of the factor structure of the schutte self-report emotional intelligence (SSREI) scale via confirmatory factor analysis, Personality and Individual Differences, 39, 1029-1042. 5.Bar-On, R. (1997). BarOn Emotional Quotient Inventory (EQ-i): Technical manual. Toronto, Ontario, Canada: Multi-Health Systems. 16.Gong, X., & Paulson, S. E. (2016). Validation of the Schutte self-report emotional intelligence scale @ IJTSRD | Available Online @ www.ijtsrd.com | Volume – 2 | Issue – 1 | Nov-Dec 2017 Page: 1441
International Journal of Trend in Scientific Research and Development (IJTSRD) ISSN: 2456-6470 with American college students. Journal of Psycho Educational Assessment, 0734282916669245. intelligence: An international handbook (181-201). Cambridge, MA: Hogrefe & Huber. 17.Goleman, D. (1998). Working with emotional intelligence. New York: Bantam Lam, L. T. & Kirby, S. L. (2002). Is emotional intelligence an advantage? An exploration of the impact of emotional and general intelligence on individual performance. Journal of Social Psychology,142(1), 133-143. 29.Petrides, K. V., Perez, J. C., & Furnham, A. (2003, July). The Trait Questionnaire (TEIQue): A measure of emotional self-efficacy. Paper presented at the 11th Biennial Meeting of the International Society for the Study of the Individual Differences (ISSID), Graz, Austria Emotional Intelligence 30.Rama Devi. V and Lakshmi Narayanamma(2014), “Academic achievement in engineering: does emotional intelligence matter? “, Journal of Contemporary Research in Management, 9; No. 3, July - Sep, 2014 18.Hyde, A.,Pethe,S., & Dhar, U. (2002). Manual for emotional Intelligence scale. Lucknow, India. Vedanta Publications. 19.Kaiser,H.F.(1970).Asecondgeneration jiffy.Psychometrika, 35,401-415. little 31.Singh Dalip(2006).Emotional Intelligence at work: A professional Guide.Sage Publications India, 14 November 2006-Business & Economics-235 pages. 20.Mayer, J. D., Salovey, P., & Caruso, D. R. (2004). Emotional intelligence: Theory, 32.Salovey, P., & Mayer, J. D. (1990). Emotional intelligence. Imagination, Personality, 9, 185-211. 21.findings, and implications. Psychological Inquiry, 15, 197-215. Cognition and 22.Mangal, Psychology. Second Education, New Delhi,Printice Hall of India Pvt.Ltd. S.K. (2007).Advanced Educational 33.Stevens, J.P.(2009).Applied multivariate statistics for the social sciences. New York, NY: Routledge 34.Tabachnick, B.G., & Fidell, L.S.(2001).Using multivariate statistics. Boston, MA: Allyn and Bacon. 23.Mangal, S.K & Mangal, S. (2004).Manual for Mangal Emotional Inventory.Agra:National Corporation. Intelligence Psychological 35.Schutte, N.S., Malouff, J.M., Hall, L.E., Haggerty, D.J., Cooper, J.T., Golden, C.J., & 24.Naeem, N., & Muijtjens, A. (2015). Validity and reliability of bilingual English-Arabic version of Schutte self-report emotional intelligence scale in an undergraduate Arab medical student sample. Medical teacher, 37(sup1), S20-S26. 36.Dornheim, L. (1998). Development and validation of a measure of emotional intelligence. Personality and Individual Differences, 25, 167-177 37.Saklofske, D.H., Austin, E.J., & Minski, P.S. (2003). Factor structure and validity of a trait emotional intelligence measure. Personality and Individual differences, 34,707-721. 25.Ng, K., Wang, C., Kim, D., & Bodenhorn, N. (2010). Factor structure analysis of the Schutte self- report emotional intelligence scale on international students. Educational Measurement, doi:10.1177/0013164409355691 and Psychological 695-709. 38.Schutte, N. S., & Malouff, J. M. (2011). Emotional intelligence mediates the relationship between mindfulness and subjective well-being. Personality and Individual Differences, 50, 1116-1119. 70(4), 26.Petrides,K.V., & Furnham,A. (2000). On the dimensional structure of emotional intelligence. Personality and Individual differences, 29, 313-320. 39.Velicer, W. F., & Fava, J. L. (1998).Effects of variable and subject sampling on factor pattern recovery. Psychological Methods, 3(2), 231-251 27.Petrides, K.V., & Furnham, A. (2003). Trait emotional intelligence: Behavioral validation in two studies of emotion recognition and reactivity to mood induction. European Journal of Personality, 17, 39-57. 28.Pérez, J. C., Petrides, K. V., & Furnham, A. (2005). Measuring trait emotional intelligence. In R. Schulze & R. D. Roberts (Eds.) Emotional @ IJTSRD | Available Online @ www.ijtsrd.com | Volume – 2 | Issue – 1 | Nov-Dec 2017 Page: 1442