Download
1 / 5
50 likes | 59 Views
A pilot investigation is being conducted to evaluate the current hydroclimatological condition of the Jawi River Basin, Malaysia. The river basin is reported to face physical changes in the near future. The basin area is located in the northern part of Peninsular Malaysia, which lies near to the equator. In this analysis, local climatology information was used since 1990 until 2010 from the Meteorological Office. The design rainstorm intensity was derived from DID Hydrological Procedure No.1, while the Hydrological Procedure No. 12 was used to compute low flows based on regional frequency analysis. The climate of the river basin reflects the equatorial climate with some monsoonal effects. Generally, the highest mean rainfall occurs in the month of October and the lowest rainfall occurs in the month of January. The 7 day low flow value for the basin is about 0.062 cubic meter per second cumecs . This means that the river basin should maintain the stream discharge at least 0.062 cumecs or above to prevent any adverse ecological impacts on the waterbody and its ecosystem. Noorazuan Md Hashim | Mohd. Azlan Abdullah "Hydroclimatological assessment of Jawi River Basin, Malaysia" Published in International Journal of Trend in Scientific Research and Development (ijtsrd), ISSN: 2456-6470, Volume-3 | Issue-4 , June 2019, URL: https://www.ijtsrd.com/papers/ijtsrd23725.pdf Paper URL: https://www.ijtsrd.com/other-scientific-research-area/enviormental-science/23725/hydroclimatological-assessment-of-jawi-river-basin-malaysia/noorazuan-md-hashim<br>

E N D
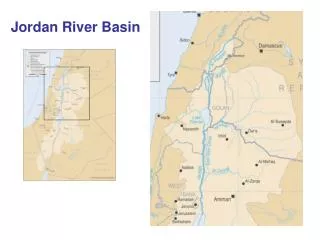
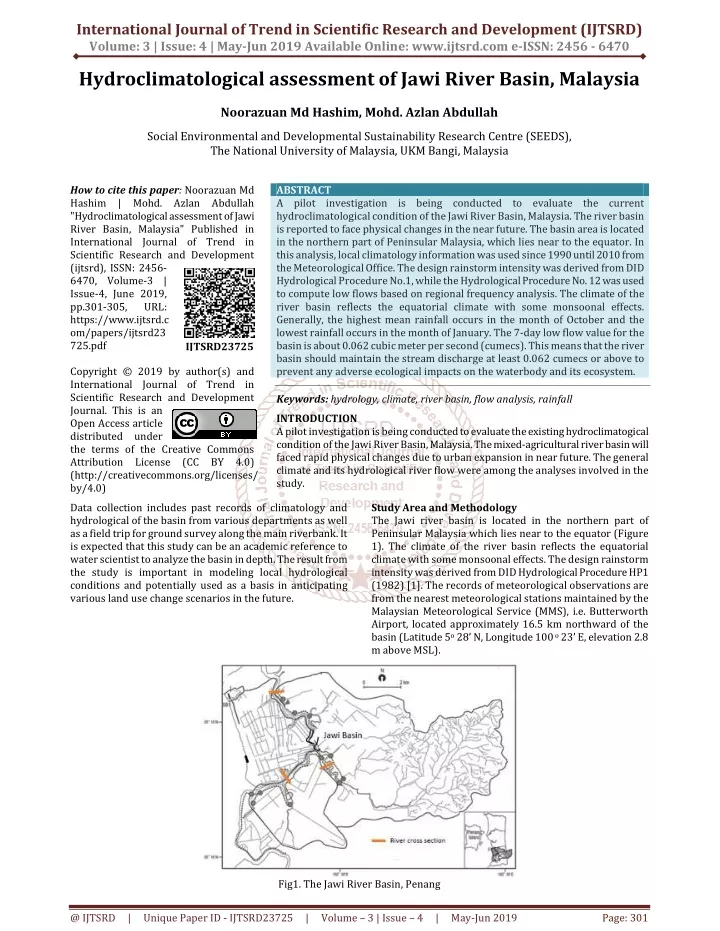
International Journal of Trend in Scientific Research and Development (IJTSRD) Volume: 3 | Issue: 4 | May-Jun 2019 Available Online: www.ijtsrd.com e-ISSN: 2456 - 6470 Hydroclimatological assessment of Jawi River Basin, Malaysia Noorazuan Md Hashim, Mohd. Azlan Abdullah Social Environmental and Developmental Sustainability Research Centre (SEEDS), The National University of Malaysia, UKM Bangi, Malaysia How to cite this paper: Noorazuan Md Hashim | Mohd. Azlan Abdullah "Hydroclimatological assessment of Jawi River Basin, Malaysia" Published in International Journal of Trend in Scientific Research and Development (ijtsrd), ISSN: 2456- 6470, Volume-3 | Issue-4, June 2019, pp.301-305, URL: https://www.ijtsrd.c om/papers/ijtsrd23 725.pdf Copyright © 2019 by author(s) and International Journal of Trend in Scientific Research and Development Journal. This is an Open Access article distributed under the terms of the Creative Commons Attribution License (CC BY 4.0) (http://creativecommons.org/licenses/ by/4.0) Data collection includes past records of climatology and hydrological of the basin from various departments as well as a field trip for ground survey along the main riverbank. It is expected that this study can be an academic reference to water scientist to analyze the basin in depth. The result from the study is important in modeling local hydrological conditions and potentially used as a basis in anticipating various land use change scenarios in the future. ABSTRACT A pilot investigation is being conducted to evaluate the current hydroclimatological condition of the Jawi River Basin, Malaysia. The river basin is reported to face physical changes in the near future. The basin area is located in the northern part of Peninsular Malaysia, which lies near to the equator. In this analysis, local climatology information was used since 1990 until 2010 from the Meteorological Office. The design rainstorm intensity was derived from DID Hydrological Procedure No.1, while the Hydrological Procedure No. 12 was used to compute low flows based on regional frequency analysis. The climate of the river basin reflects the equatorial climate with some monsoonal effects. Generally, the highest mean rainfall occurs in the month of October and the lowest rainfall occurs in the month of January. The 7-day low flow value for the basin is about 0.062 cubic meter per second (cumecs). This means that the river basin should maintain the stream discharge at least 0.062 cumecs or above to prevent any adverse ecological impacts on the waterbody and its ecosystem. Keywords: hydrology, climate, river basin, flow analysis, rainfall INTRODUCTION A pilot investigation is being conducted to evaluate the existing hydroclimatogical condition of the Jawi River Basin, Malaysia. The mixed-agricultural river basin will faced rapid physical changes due to urban expansion in near future. The general climate and its hydrological river flow were among the analyses involved in the study. Study Area and Methodology The Jawi river basin is located in the northern part of Peninsular Malaysia which lies near to the equator (Figure 1). The climate of the river basin reflects the equatorial climate with some monsoonal effects. The design rainstorm intensity was derived from DID Hydrological Procedure HP1 (1982) [1]. The records of meteorological observations are from the nearest meteorological stations maintained by the Malaysian Meteorological Service (MMS), i.e. Butterworth Airport, located approximately 16.5 km northward of the basin (Latitude 5o 28’ N, Longitude 100 o 23’ E, elevation 2.8 m above MSL). IJTSRD23725 Fig1. The Jawi River Basin, Penang @ IJTSRD | Unique Paper ID - IJTSRD23725 | Volume – 3 | Issue – 4 | May-Jun 2019 Page: 301
International Journal of Trend in Scientific Research and Development (IJTSRD) @ www.ijtsrd.com eISSN: 2456-6470 Based on the monthly data obtained from Bayan Lepas climatological station, the average monthly and annual potential evapotranspiration (PET) were calculated. The estimation was based on the Thornthwaite Model [2]. The equation is, PET = 1.63N [10 T/I]a ………………...…………........... 1 Where N = a factor to correct for unequal day length, T = monthly mean air temperature, I = summation of monthly heat index. The I was calculated by using the equation; Where Tj = the mean monthly temperature during j (oC), a = a cubic function of l given by, a = 0.49 + 0.0179*1-0.0000771*12 + 0.000000675*13 ……………..3 For this study, the monthly daylength correction factors (N) are based on the Lat 0< 5oN. The values are listed in Table 1. Table 1: Daylength correction factors (N) for Thornthwaite equation Lat J F M A M 0<5 1.04 0.94 1.04 1.01 1.04 1.01 1.04 1.04 1.01 1.04 1.01 1.04 Hydrological Procedure No. 12 [3] was used to compute low flows based on regional frequency analysis. Four low flow regions were identified and using this procedure design low flows of return periods between 1 and 25 years could be determined. The mean annual rainfall (MAR) is about 2250 mm, based on the DID (1976)[3]. The mean annual minimum value was computed by using the equation below, MAM = 1.097 x 10 -8 (AREA) 1.092 (MAR) 1.663 …………….4 Result and Discussion In general, there is a seasonal variation in the rainfall within the river basin, which is a result of the monsoonal phenomenon. There are four rainfall regimes that can be distinguished, i.e. Southwest monsoon (May to September), the Northeast monsoon (November to March), and two inter monsoonal periods. Generally, average annual rainfall of the area is between 2,000 to 3,000 mm. During the Southwest season, the basin area receives abundant rainfall and sometime produced heavy torrential rains that could trigger flash flood in urban areas [4]. The sea land breezes could also effected the coastal line, especially to the mainland area where sometime it can enhanced the development of Sumatra’s line squalls. Generally, the highest mean rainfall occurs in the month of October and the lowest rainfall occurs in the month of January. The wet seasons occur in the inter-monsoon periods, April and October. Based on 11 years observation, the maximum rainfall was recorded in October (393 mm) while the minimum, amounting of 67.5 mm was recorded in January (Figure 2). J J A S O N D Fig 2. Rainfall monthly variation in the study area Humidity and temperature show very little variation throughout a year. In general, due to maritime nature and high rainfall at the island, the humidity is above 80 %. The local climate is depend on the northeast and southwest monsoon wind. In general, the rainfall trend shows relatively high annual rainfall for the river basin area. The average annual rainfall depth is approximately 2,299 mm ranging from 1500 to 3200 mm over 11-year, the maximum rainfall was recorded in 1999 while the @ IJTSRD | Unique Paper ID - IJTSRD23725 | Volume – 3 | Issue – 4 | May-Jun 2019 Page: 302
International Journal of Trend in Scientific Research and Development (IJTSRD) @ www.ijtsrd.com eISSN: 2456-6470 lowest is year 2002 . Figure 3 shows 2D diurnal variation of rainfall for the basin. Nieuwolt [5] has shown that the diurnal rainfall amount pattern varies with the season. During the southwest monsoon, which is the driest time of the year, the largest amount of rainfall in the basin particularly during mid-day. This indicates that the rainfall is largely due to local convection. The major different in the Southwest monsoon was the high intensity of rainfall in the early morning at the island, where as a high intensity of rainfall in the early night at the mainland. This is due to the ocean-land interaction in affecting the occurrence of the rainfall diurnal variation. Figure 3. Hourly variation of rainfall based from Butterworth station (1995-2010) The rainfall-intensity-frequency (IDF) information from 2 to 100-years average recurrence interval (ARI) is shown in Table 1 and Sg Jawi (representating the mainland site) where the basin is located. Figure 4 shows the plotted IDF diagram for the area. Table 1: Rainfall for various duration and return periods for Jawi basin at Bt Tambun Duration Rainfall depth for various return periods (mm) 2 yr 5 yr 10 yr 0.5h 35 45 52 01h 70 81 102 03h 80 93 105 06h 90 119 123 12h 105 135 152 24h 130 165 189 25 yr 60 113 115 136 170 210 50 yr 68 122 122 153 195 235 100 yr 78 133 137 166 215 270 Figure4. Plot of rainfall IDF for Jawi basin at Bt Tambun The monthly fluctuations in ambient air temperature are much less than rainfall fluctuation. The ambient temperature at the river basin was fluctuated between the lowest minimum at 26.8oC (December) and highest maximum 28.5oC (May). The mean monthly temperature peaks around May to June. Overall, the air temperature for Jawi basin is about 27.7oC. The hourly fluctuations shows that the highest ambient temperature was between 1300 to 1400 local time. In general, the basin area follows the Peninsular trend which has high humidity. The mean monthly relative humidity falls within 70 to 85%. The minimum range of mean relative humidity varies from a low 72% in January to 83 % in October. Detail monthly evaporation from the station for 11 years (1995-2005) is presented in Figure 5. The average daily evaporation is about 3.74 mm. The month of February was the highest evaporation value (above 4.5 mm), in which can be associated with the southwest monsoon. The lowest evaporation value was in October, where the highest rainfall can be observed. @ IJTSRD | Unique Paper ID - IJTSRD23725 | Volume – 3 | Issue – 4 | May-Jun 2019 Page: 303
International Journal of Trend in Scientific Research and Development (IJTSRD) @ www.ijtsrd.com eISSN: 2456-6470 Figure 5: Mean daily evaporation at the basin area (1995-2010) It can be seen that during the wet months (September to October), PET values are lower due to cloud coverage and higher humidity. However, the potential evapotranspiration was higher during the dry months. The average annual PET for the station is about 1922 mm. The river basin is under the influence of the region’s two dominant surface winds, i.e. north easterlies and the south-westerlies [6]. It is showed that the north easterlies wind was dominant at the mainland site, while north wind was dominant at the island site. Throughout the year, the average winds are lights, seldom exceeding 8 m/s. Calm periods are more frequent at the Bayan Lepas station for 20.7% of the time. The demarcation of the basin is based on topographic divide that is done using the recent topographic map sheet number 3365 and 3265 (Table 2). It is difficult to demarcating the basin boundary at the downstream due to the man-made irrigation canals. However, the problem solved when applying the layout of drainage maps produced by both DID agencies, i.e. DID Wilayah Baratdaya and DID SPS. In basin area previously was oil palm plantation owned by Batu Kawan Estate, a British company. They built their owned borrow pit canal along the coastal embankment, with two tidal control gates to flush out discharge, i) near Sg Batu Kawan and ii) at the center of the Batu Kawan coastal line. The old topomap (1985) showed these gates were active in 1984 as the flow line (flow banding) can be easily recognised. However, in the latest SPOT image of 2005, the flow line is no longer exist except for Sg Jawi and Sg Tengah flow lines to the sea. Based on field survey, both tidal control gates are not in used anymore. According to JPS (SPS) personnel, there are no official drainage layout at Batu kawan Island as this area maintained by the British owner. In existing condition, the excessive water will flush out to two natural outlets, flowing to Sg Jawi. Table2. The sub-basin’s hydrological information Basin Width (km) 1 Sg Tengah - Daun 22.2 6.1 2 Upper Sg Jawi 60.5 6.5 3 Sg Bakar Arang 15.5 3.3 4 Sg Binjai 2.1 1.2 5 Bt Kawan Island 18.9 5.9 6 Sg Bt Kawan 0.65 0.7 Source: Topographical Maps Sheet 3365 & 3265. At upper Sg Jawi, due to sedimentation and muddy environment, the river flow is about 0.138m/s, and sometime the water stagnant even though in low tide. The river system is very much affected by tidal. The river bund along Sg Jawi – Sg Tengah is in a range of 1.5 to 2.0 m from ground level. In the Batu Kawan Island, no flood event being reported (or overflow of Sg Jawi/Sg Tengah into the catchment) based on flood annual report (1996 to 2006) from JPS Ampang. JPS SPS maintain the drainage of the area. There are two tidal control gates (manual) and one automatic flap gate (stainless steel frame) maintained by JPS SPS to control river flow as well as avoiding the sea water overflow in high tide. In general, most floods in the basin are caused by a combination of heavy rainfall (sometimes to about 100 years ARI) and high spring tides. The storms usually occurred in the month of October (intermediate monsoon) that bring continous and heavy rainfall. According to DID report [7] [8], the flood usually lasted for a duration of between 1 and 2 days. Based on their records, rainfall that are between 30 to 100 years ARI could bring worst scenario of flash flood, especially to the low lying areas near main rivers. In this study, the 7Q10 flow for Sg Bakar Arang sub basin has been selected as the suitable basin due to the nearness of PFA at Val Dor. Thus, the design flow could give the minimum discharge for protecting the aquatic environment as well as preventing any adverse biology/ecological impacts. Table 3 below shows the estimated 7-day low flow for the sub basin. The 7Q10 value for the sub basin is about 0.062 cumecs. This means that the basin should maintain the stream discharge at least 0.062 cumecs or above to prevent any adverse ecological impacts on the waterbody and its ecosystem. Table 3: 7-day low flow estimates for Sg Bakar Arang subbasin T (Years) 7-days low flow Q7, T(cumecs) 01.5 02.33 05.0 10.0 20.0 50.0 Total Stream Length (km) 41.4 138.5 46.0 2.7 99.6 1.75 Area (km2) Basin Length (km) Drainage density (km/km2) No Basin Name 5.6 13.7 7.5 2.2 4.5 0.7 1.86 2.29 2.97 1.29 5.27 2.69 1.100 0.099 0.072 0.062 0.058 0.051 @ IJTSRD | Unique Paper ID - IJTSRD23725 | Volume – 3 | Issue – 4 | May-Jun 2019 Page: 304
International Journal of Trend in Scientific Research and Development (IJTSRD) @ www.ijtsrd.com eISSN: 2456-6470 [4]Chan 1995 Chan N W 1995 A Geographical Perspective of Flood Hazard Creation and Perpetuation in Peninsular Malaysia. Kajian Malaysia, XIII No. 2, Dec., 20-46 Conclusion In general, there is a seasonal variation in the rainfall within the river basin, which is a result of the monsoonal phenomenon. Humidity and temperature show very little variation throughout the year. The monthly fluctuations in ambient air temperature are much less than rainfall fluctuation. The river basin is under the influence of the region’s two dominant surface winds, i.e. north easterlies and the south-westerlies. The river system is very much affected by tidal system. The result from the study can be utilized for modeling the local hydrological conditions based on several land use change scenarios in the future. References [1]DID. 1982. Hydrological Procedure No.1: Estimation of The Design Rainstorm in Peninsular Malaysia, Ministry of Agriculture, Kuala Lumpur. [5]Nieuwolt. S. 1968. Diurnal Rainfall Variation in Malaya Annals of the Association of American Geographers, Vol. 58, No. 2 (Jun., 1968), pp. 313-326 [6] Chan et al 1998 Urban Sustainability and the Effects of Rapid Socio-Economic, Industrial and Infrastructure Development in Penang Island on the Environment, with special reference to Soil Erosion, Landslides, Water Pollution and Flooding - Final Report. UNDP/ISIS Programme of Research Grants for Small-Scale Projects on Environment and Development. [7]DID. 1978. Hydrological Procedure No.12: Hydrological regions of Peninsular Malaysia, Ministry of Agriculture, Kuala Lumpur. [2]Ponce, V. M., 1989. Engineering Hydrology, Principles and Practices, Prentice Hall. [8]MASMA. 2001. Urban Storm water Management Manual for Malaysia, PNSB, Kuala Lumpur, Volume 1, 4 and 5. [3]DID 1985. Hydrological Procedure No 1985. Magnitude and frequency of low flows in Peninsular Malaysia Jabatan Pengairan dan Saliran. Ministry of Agriculture, Kuala Lumpur. @ IJTSRD | Unique Paper ID - IJTSRD23725 | Volume – 3 | Issue – 4 | May-Jun 2019 Page: 305