Download
1 / 7
70 likes | 75 Views
The main objective of the power system planner is to provide dependable and cost effective power supply to the customer. Due to the advancement in the technology, power system structure has been remodeled which in turn attracts the more number of participants to participate in the electricity market. Increase in market participant increases the utilization level in the distribution side of the power system. One among the technical challenges facing due to the increase in the load level is maintaining the power balance of the power system with respect to the load variations. In recent years, the inclusion of distributed generations DGs efficiently resolves the above power shortage problem. Incorporating the DG sources in the power system network helps to improve the aspects such as power quality, bus voltage profiles and voltage stability of the system. It also has the characteristics of economic and reliable power supply to customers. The extent of these benefits depends on how the DG is placed and sized in a system. Improper allocation of DG sources in power system would not only lead to increase power or energy losses, but also can endanger the system operation. In this paper, a multi objective optimization problem for improving the voltage profile and voltage stability index has been solved by optimal placing and sizing of DG in standard 33 bus and 69 bus radial distribution systems with three tools such as Genetic Algorithm GA , Particle Swarm Optimization PSO and Flower Pollination Algorithm FPA . The comparison results are recorded. Mareesan K | Dr. Shunmugalatha A "Improvement of Voltage Profile in Distribution System by Optimal Placement and Sizing of DG" Published in International Journal of Trend in Scientific Research and Development (ijtsrd), ISSN: 2456-6470, Volume-3 | Issue-1 , December 2018, URL: https://www.ijtsrd.com/papers/ijtsrd19053.pdf Paper URL: http://www.ijtsrd.com/engineering/electrical-engineering/19053/improvement-of-voltage-profile-in-distribution-system-by-optimal-placement-and-sizing-of-dg/mareesan-k<br>

E N D
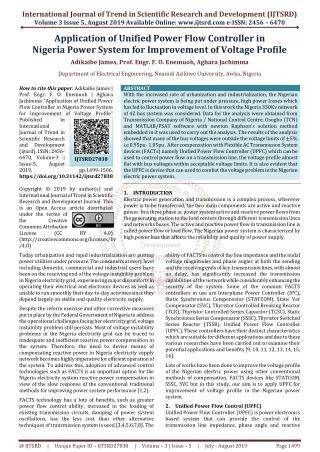
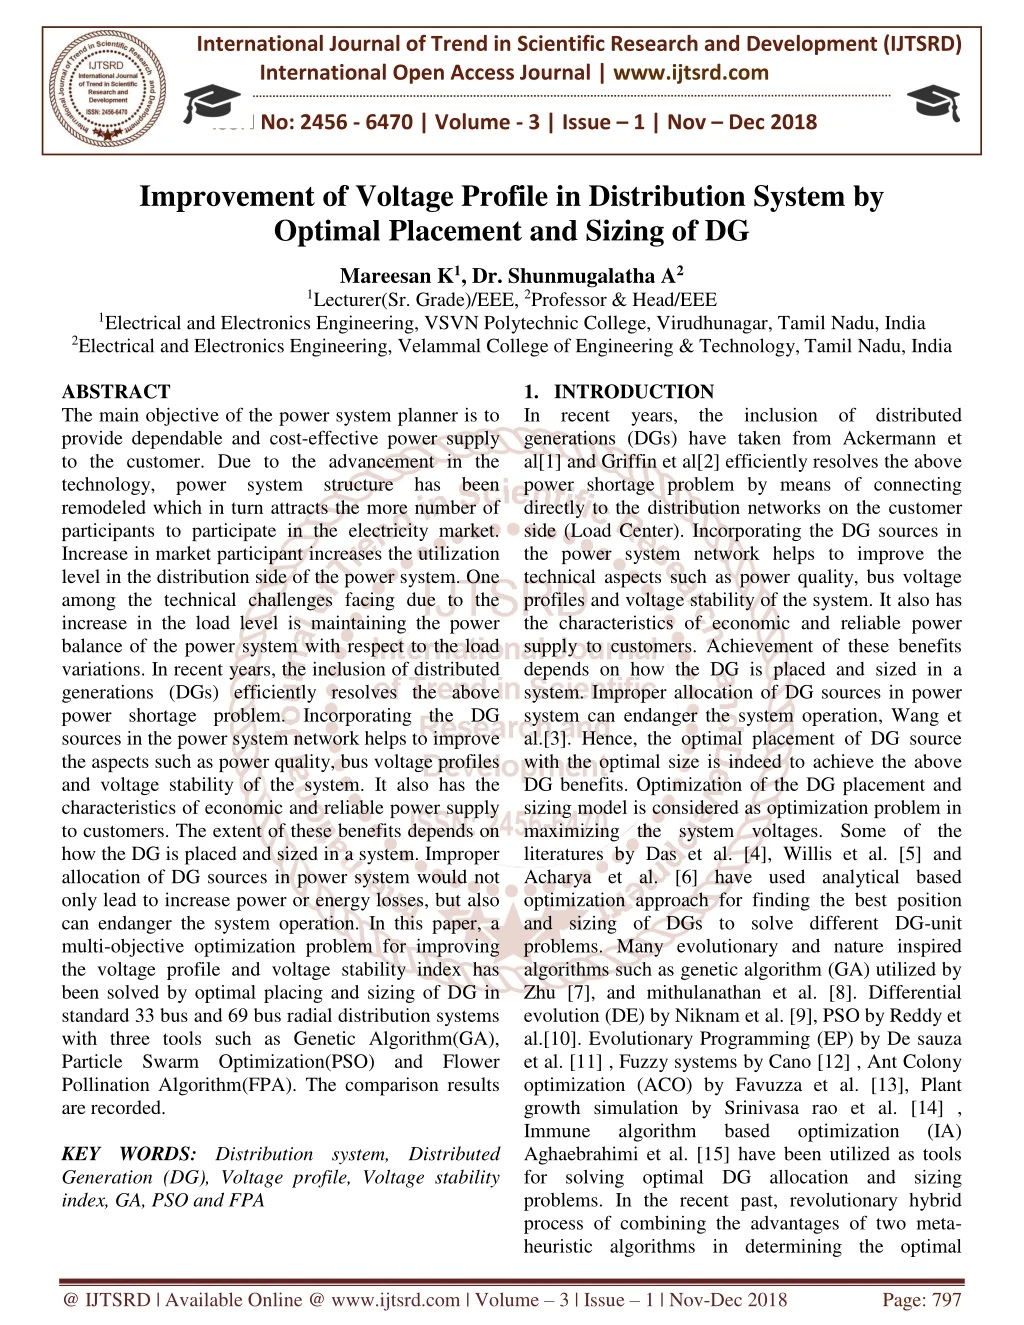
International Journal of Trend in Scientific Research and Development (IJTSRD) International Open Access Journal | www.ijtsrd.com ISSN No: 2456 - 6470 | Volume - 3 | Issue – 1 | Nov – Dec 2018 Improvement of Voltage Profile in Distribution System by Optimal Placement and Sizing of DG Mareesan K1, Dr. Shunmugalatha A2 1Lecturer(Sr. Grade)/EEE, 2Professor & Head/EEE 1Electrical and Electronics Engineering, VSVN Polytechnic College, Virudhunagar, Tamil Nadu, India 2Electrical and Electronics Engineering, Velammal College of Engineering & Technology,Tamil Nadu, India ABSTRACT The main objective of the power system planner is to provide dependable and cost-effective power supply to the customer. Due to the advancement in the technology, power system structure has been remodeled which in turn attracts the more number of participants to participate in the electricity market. Increase in market participant increases the utilization level in the distribution side of the power system. One among the technical challenges facing due to the increase in the load level is maintaining the power balance of the power system with respect to the load variations. In recent years, the inclusion of distributed generations (DGs) efficiently resolves the above power shortage problem. Incorporating the DG sources in the power system network helps to improve the aspects such as power quality, bus voltage profiles and voltage stability of the system. It also has the characteristics of economic and reliable power supply to customers. The extent of these benefits depends on how the DG is placed and sized in a system. Improper allocation of DG sources in power system would not only lead to increase power or energy losses, but also can endanger the system operation. In this paper, a multi-objective optimization problem for improving the voltage profile and voltage stability index has been solved by optimal placing and sizing of DG in standard 33 bus and 69 bus radial distribution systems with three tools such as Genetic Algorithm(GA), Particle Swarm Optimization(PSO) and Flower Pollination Algorithm(FPA). The comparison results are recorded. KEY WORDS: Distribution system, Distributed Generation (DG), Voltage profile, Voltage stability index, GA, PSO and FPA 1.INTRODUCTION In recent years, the inclusion of distributed generations (DGs) have taken from Ackermann et al[1] and Griffin et al[2] efficiently resolves the above power shortage problem by means of connecting directly to the distribution networks on the customer side (Load Center). Incorporating the DG sources in the power system network helps to improve the technical aspects such as power quality, bus voltage profiles and voltage stability of the system. It also has the characteristics of economic and reliable power supply to customers. Achievement of these benefits depends on how the DG is placed and sized in a system. Improper allocation of DG sources in power system can endanger the system operation, Wang et al.[3]. Hence, the optimal placement of DG source with the optimal size is indeed to achieve the above DG benefits. Optimization of the DG placement and sizing model is considered as optimization problem in maximizing the system voltages. Some of the literatures by Das et al. [4], Willis et al. [5] and Acharya et al. [6] have used analytical based optimization approach for finding the best position and sizing of DGs to solve different DG-unit problems. Many evolutionary and nature inspired algorithms such as genetic algorithm (GA) utilized by Zhu [7], and mithulanathan et al. [8]. Differential evolution (DE) by Niknam et al. [9], PSO by Reddy et al.[10]. Evolutionary Programming (EP) by De sauza et al. [11] , Fuzzy systems by Cano [12] , Ant Colony optimization (ACO) by Favuzza et al. [13], Plant growth simulation by Srinivasa rao et al. [14] , Immune algorithm based Aghaebrahimi et al. [15] have been utilized as tools for solving optimal DG allocation and sizing problems. In the recent past, revolutionary hybrid process of combining the advantages of two meta- heuristic algorithms in determining the optimal optimization (IA) @ IJTSRD | Available Online @ www.ijtsrd.com | Volume – 3 | Issue – 1 | Nov-Dec 2018 Page: 797
International Journal of Trend in Scientific Research and Development (IJTSRD) ISSN: 2456-6470 solution has been practiced in many applications. The above revolutionary way of combining GA and PSO has been used in determining the optimal placement of DG by Moradi et al. [16]. In recent years, papers such as Abou et al. [17] has proposed the technical objective of minimizing the line power loss and maximizing the voltage profile. So, in order to extract the better solutions of technical aspects in the real time, multi-objective optimization problem is needed to be designed for extracting the maximum voltage stability and voltage stability Index. Based on the above proposal, two objectives such as maximizing the voltage profile and maximizing the voltage stability index of the distributed systems while satisfying the voltage profile security constraints and the power balance constraints are achieved by designing the multi-objective optimization problem as a single cost function. Here, the two objectives are converted into single objective by using weighted sum method. To demonstrate the effectiveness of the proposed optimization method, IEEE standard 33 bus and 69 bus radial distribution test system have been utilized. To extract the best solutions of the multi- objective based problem, nature inspired flower pollination algorithm (FPA) is used as an optimization tool. To demonstrate the efficiency of the FPA, standard evolutionary algorithms such as Genetic Algorithm (GA) and Particle Swarm Optimization (PSO) are also used to extract the optimal solutions. 2.PROBLEM FORMULATION Best solutions of maximizing voltage profile at the maximum voltage stability of the system are extracted by means of formulating the multi-objective problem into the single cost functions using the penalty coefficients and the weighted sum method. Therefore, the multi-objective problem has been converted into a single objective solution. 2.1 Multi-Objective Problem Formulation The proposed multi-objective problem (FT)is designed in such a way to fulfill the goals of objective functions such as System’s voltage profile maximization(F1), and Voltage stability index maximization (F2) in the distributed system. By using weights w1 and w2 the two objectives are converted into single objective function by satisfying the power balance constraints and voltage profile constraint. ??????(min) and ??????(max) are the minimum and maximum bus voltage of the distribution test system. The value between 0.98 to 1 is considered as rated voltage profile of the system. 2.2 Voltage Profile Function Maintenance of voltage at all buses in the radial distribution system (RDS) helps to provide better quality of power supply with respect to the load variations. Also the bus voltage profile of the distributed system majorly impacts the pricing value in the electricity market. Hence, it is important to maintain the voltage profile of each bus at the maximum limit to accommodate conditions w.r.t sudden change in the load level. So, in order to maximize the voltage profile, following function is considered F1=∑ (??− ??????)2 ?=1 where, ?????? is the rated voltage of the RDS. The value of rated voltage is unity. 2.3 Voltage Stability Function Voltage stability of radial distributed system gets impacted by the application of DG in the distribution system. Improper placement of DG decreases voltage stability of the system. The voltage stability of the system is evaluated at each node by means of calculating the index value at each node. To improve the voltage stability index, the following function is designed F2= vulnerable ?? ….(2) 1 ???(????)…..(3) Where, ???? is the Voltage stability index of the ith bus in RDS. The ???? is calculated from the following formula ????= |???|4 -4[??? ??+ ??? ??]|???|2 -4[??? ??+ ??? ??] 2…...(4) Where, ??? is the ith bus voltage of the RDS, ?? ??? ?? are the resistance and reactance of the ith bus distribution branch, ??? ??? ??? are the real and reactive power of the load fed by the ith bus. Low voltage stability index bus is the weak bus in the RDS. The above voltage stability index formula is extracted from the literature by Chakravorty et al. (2001). So, in order to improve the voltage stability ??= ???(?1∗ ?1 + ?2∗ ?2 + ?1∗ ???(( ??????(???) –???(??)),0) + ?2∗ ??? (( ???(??) − ??????(???) ),0)) ... (1) @ IJTSRD | Available Online @ www.ijtsrd.com | Volume – 3 | Issue – 1 | Nov-Dec 2018 Page: 798
International Journal of Trend in Scientific Research and Development (IJTSRD) ISSN: 2456-6470 index, the minimized voltage stability index of the RDS is extracted and it gets inversed. 2.4 Operating Constraints The above single objective (??) converted to multi- objective focused problem needs to be attained by satisfying the following static operational limit values. Constraint I: Voltage Limit Constraint Vimin ≤ Vi ≤ Vimax … (5) Constraint II: DG Capacity Constraint PDGmin ≤ PDG ≤ PDGmax … (6) Pfmin ≤ Pf ≤ Pfmax … (7) Reactive power formulation of the distributed generation from the real Power is given as below QDG = (PDG).tan( Cos−1(Pf) ) Constraint III: Power balancing Constraints PGi− PDi− Vi ∑ VjYij Cos( θij− δi i=1 ..(9) QGi− QDi− Vi ∑ VjYij Sin ( θij− δi i=1 ..(10) where, Vimin and Vimax are the minimum and maximum permissible voltage at ithbus, PDGmin and PDGmax are the minimum and maximum permissible real power value of each DG capacity, PGi and QGiare the real and reactive power from DG in p.u, Pfmin and Pfmax are the minimum permissible Power factor value of each DG capacity, PDi and QGi are the real and reactive power load demand in p.u, Vi and Vj are the voltage magnitude at the ithand jthbus in p.u, δi and δj are the voltage angle at the ithand jthbus in p.u, N is the total number of bus in distributed system, Yij is the magnitude of admittance matrix and θij is the angle of admittance matrix between ith and jth bus in p.u. 3.WEIGHTED SUM METHOD Weighted sum method helps to linearize the multi- objective problem by means of choosing the weighted coefficients ?? corresponding to the multi-objective optimization problems. The weighted sum problem formulation is provided as below ??= ∑ ?? ?=1 ∗ ?? Where, the converted linear objective of multi- objectives (MO) problem is ??, ?? is the ith single objective and ?? is the ith weighted value ofthe single objective. Sum of all the weighted value is equal to one. 4. PTIMIZATION ALGORITHM STRUCTURE Stochastic algorithms such as Genetic Algorithm (GA), Particle Swarm Optimization (PSO) and Flower Pollination Algorithm (FPA) are used to solve the optimization problem of maximizing the voltage profile and voltage index of the DS with the optimal allocation of pre-determined number of DG’s in the specified timing and also not violating the system operation limits. The structure of the optimization algorithm in implementing the multi-objective focused objective problem has been explained as follows. 4.1 Genetic Algorithm (GA) Structure As per the objective function, the control parameters are bus position and sizing. So, based on the control parameters, the population has ‘n’ chromosomes that represent candidate solutions. Each chromosome is real value vector with the bus location number and the size of DG in Genetic Algorithm. Here, the chromosomes consist of six genes. First three genes indicate the position of DG and remaining three genes indicate the size of DG in each bus position. 4.2 Particle Swarm Optimization(PSO) structure The PSO has been designed to have ‘N’ particles in the population that represent candidate solution. Each particle is the real value vector with the ‘M’ location number and size of DG for each load level. 4.3 Flower Pollination Algorithm Structure FPA based stochastic algorithm is a highly effective and efficient to solve difficult optimization problems. FPA is the nature inspired algorithm and gaining popularity recently for solving nonlinear optimization problems. Flower pollination algorithm (FPA) proposed by Xin-She Yang in 2012, is based on flower pollination behavior. Two types of pollination occur namely self-pollination and cross-pollination. Self-pollination occurs when pollen from one flower pollinates the same flower or other flowers of the same plant. On the other hand, cross-pollination means pollination can occur from pollen of a flower of a different plant. Biotic, cross-pollination occurring at long distance may be called as the global pollination initiated by the pollinating agents such as bees, bats, birds and flies which could fly a long distance. Behaviors such as jump or fly distance of bees and birds obey a Levy distribution. … (8) N + δj) = 0 N + δj) = 0 and maximum ? ... (11) @ IJTSRD | Available Online @ www.ijtsrd.com | Volume – 3 | Issue – 1 | Nov-Dec 2018 Page: 799
International Journal of Trend in Scientific Research and Development (IJTSRD) ISSN: 2456-6470 5.RESULTS AND DISCUSSION The proposed multi objective formulation has been implemented with the help of two standard radial distribution test system. The first test system is IEEE 33 bus radial distribution test system with the total system load of 3.72 MW and 2.3 MVar with the 32 branches. While the initial system power loss of the 33 bus system is 210.908 kW and the reactive power loss is 143 kVar. The system voltage base is 12.66 kV and the base apparent power is 10 MVA. The second test system is the IEEE 69 bus radial distribution test system with the total system load of 3.80 MW and 2.69 MW. While the initial system power loss of the 69 bus system is 224.9 kW and the reactive power loss is 102.1 kVar. GA, PSO and FPA based optimization algorithms are used to extract the best Simulation Results of Multi-Objective Focused Problem Formulation with Unity Power Factor DGs Table 5.1 GA, PSO and FPA based optimization results for 33 bus RDS RDS Test system 13 1054.59 1.0388 0.000703 0.45568 0.9916 33 29 1847.85 24 1314.09 13 1054.59 1.0391 0.000703 0.45566 0.9918 33 29 1850.77 24 1319.69 29 1865.25 1.0398 0.000691 0.45617 0.9918 33 24 1324.73 14 1024.29 Table 5.2 GA, PSO and FPA based optimization results for 69 bus RDS RDS Test system 18 591.52 1.0235 0.00045 0.4411 0.9942 50 55 772.90 61 1994.65 17 551.17 1.0236 0.00055 0.4411 0.9941 65 55 842.16 61 1980.62 61 1155.01 1.0251 14 808.27 62 999.96 optimized solution by means of finding best distributed generation site and sizing. Three best locations for DG placement have to be identified and the best sizing for each DG should be less than 2000 KW has been assumed. Weighted value (W1 and W2) is determined as 0.5 each using trial and error method. Similarly, the value of penalty coefficients(?1, ?2) is 1000. In this chapter, DG power generation with unity power factor is optimized to achieve the better voltage stability and profile. MATLAB simulation of FPA, PSO and GA algorithm for the 33 and 69 bus RDS test systems have been conducted with the DG’s unity power factor. The simulation result has been recorded and the details are provided below with the explanation. Critical Voltage Critical Voltage Fitness in per F2 in per unit F1 in per unit Sizing in kW in per unit Algorithm Bus no unit Bus FPA 33 Bus system PSO GA Critical Voltage Critical Voltage Fitness in per F2 in per unit F1 in per unit Sizing in kW in per unit Algorithm Bus no unit Bus FPA 69 Bus system PSO GA 0.001 0.4421 0.9938 65 @ IJTSRD | Available Online @ www.ijtsrd.com | Volume – 3 | Issue – 1 | Nov-Dec 2018 Page: 800
International Journal of Trend in Scientific Research and Development (IJTSRD) ISSN: 2456-6470 Figure 5.2 69 bus RDS voltage profile for GA, PSO and FPA based optimization algorithm It is inferred from the table 5.1 and table 5.2 that the FPA provides better improved voltage profile (F1) by means of reducing the voltage difference with respect to the rated voltage and better voltage stability index (F2) in 33 bus and 69 bus test radial distributed system. The FPA based optimization solution provides better and balanced voltage profile compared to the GA and PSO. The above is depicted with the help of voltage profile comparison graph implemented in the 33 and 69 bus RDS system shown in the figure 5.1 and figure 5.2 respectively. Figure 5.1 33 bus RDS voltage profile for GA, PSO and FPA based optimization algorithm 5.2 Optimization Measure The statistical measures such as mean, best, standard deviation and the multi-technical objective focused single objective solutions of the three algorithms for the two test systems are recorded in the table 5.3 by conducting 20 different trials. Algorithm’s Performance Table 5.3 Statistical measure of GA, PSO and FPA Test System 33 Bus GA 0.45617 0.45892 0.46264 0.001973 610 69 Bus GA 0.4421 0.4624 Iteration for Algorithm Maximum Minimum Deviation Standard Mean No of FPA 0.45568 PSO 0.45566 0.45945 0.46212 0.001811 500 0.4582 0.46189 0.001757 380 FPA PSO 0.4411 0.4411 0.4488 0.4618 0.4549 0.4688 0.4709 0.005109 450 0.006268 590 0.006905 860 From the statistical performance table.5.3, it is inferred that the optimal solutions of FPA for the two test system is better compared to GA and PSO also the number of iterations for extracting best solution using FPA is better than compared to GA and PSO for all the test systems. The above is obvious from the three algorithm’s convergence graph in figure 5.3 and figure 5.4 for the 33 bus and 69 bus respectively. It is also inferred that the best multi-objective focused solution is extracted around the low standard deviation using FPA algorithm compared to that of GA and PSO algorithm. So, it is evident that FPA provides better balance in intensification and diversification process while searching the global optimal minima. Figure 5.3 GA, PSO and FPA based optimization convergence graph for 33 bus RDS 0.475 FPA PSO GA 0.47 0.465 Fitness in p.u 0.46 0.455 0.45 0 100 200 300 400 500 600 700 800 900 1000 Generation @ IJTSRD | Available Online @ www.ijtsrd.com | Volume – 2 | Issue – 6 | Sep-Oct 2018 Page: 801
International Journal of Trend in Scientific Research and Development (IJTSRD) ISSN: 2456-6470 Figure 5.4 GA, PSO and FPA based optimization convergence graph for 69 bus RDS radial distribution networks’, International journal of Electrical Power & Energy Systems, vol. 17, no. 5, pp. 335-346. 5.Willis, HL 2000, ‘Analytical methods and rules of thumb for modeling dg-distribution interaction’, IEEE Power Engineering Society Summer Meeting, vol. 3, pp. 1643-1644. 6.Acharya, N, Mahat, P & Mithulananthan, N 2006, ‘An analytical approach for DG allocation in primary distribution Journal of Electrical Power Energy System, vol. 28, pp. 669-746. 7.Zhu, JZ 2002, ‘Optimal reconfiguration of electrical distribution network using the refined genetic algorithm’, Electric Power Systems Research, vol. 62, pp. 37-42. 8.Mithulananthan, N, Than Oo, Van Phu, L 2004, ‘Distributed generator placement in power distribution system using genetic algorithm to reduce losses’, Thammasat International Journal of Science Technology, vol. 9, no. 3. 9.Niknam, T, Ranjbar, AM, Shirani, AR, Mozafari, B & Ostadi, B 2005, ‘Optimal operation of distribution system with regard to distributed generation: A comparison of evolutionary methods’, IEEE Conference, vol. 4, pp. 2690-2697. 10.Reddy, SC, Prasad, PVN & Laxmi, AJ 2012, ‘Reliability improvement of distribution system by optimal placement of DGs using PSO and neural network’, IEEE Conference, International Conference on Computing, Electronics and Electrical Technologies (ICCEET), pp. 156-162. 11.De Souza, BA & De Albuquerque, JMC 2006, ‘Optimal Placement of Distributed Generators Networks Using Evolutionary Programming’, Transmission & Distribution Conference and Exposition: Latin America, IEEE/PES, pp. 1-6. 12.Cano, EB 2007, ‘Utilizing fuzzy optimization for distributed generation TENCON, pp. 1-4. 13.Favuzza, S, Graditi, G, Ippolito, MG & Sanseverino, ER 2007, ‘Optimal electrical distribution systems reinforcement planning using gas micro turbines by dynamic ant colony search algorithm power systems’, IEEE Transactions on Power Systems, vol. 22, no. 2, pp. 580-587. 0.47 FPA PSO GA 0.465 0.46 Fitness in p.u 0.455 0.45 network’, International 0.445 0.44 0 100 200 300 400 500 600 700 800 900 1000 Generation 6.CONCLUSION This Chapter mainly presents the application of DG in extracting the technical objectives such as voltage profile improvement and voltage stability index maximization by optimally determining the placement and sizing of DG with unity power factor by considering the system security limits. From the simulation results, it is evident that the proposed optimization problem extracts the better solutions of maximum voltage profile and voltage stability index by minimizing the voltage difference with the standard bus voltage. Also it is concluded that the application of FPA in solving the proposed optimization provides the most definite solution by maintaining the good balance in exploring the global minima and exploiting the local minima. Thus the proposed multi-technical optimization problem helps to maintain the system stability and voltage profile at higher balance. REFERENCES 1.Ackermann, T, Andersson, G & So¨der, TF 2001, ‘Distributed generation: A definition’, Electric Power Systems Research, Elsevier. 2.Griffin, T, Tomsovic, K, Secrest, D & Law, A 2000, ‘Placement of dispersed generations systems for reduced losses’, Proceedings of the 33rd Hawaii International Conference on System Sciences. 3.Wang, C & Nehrir, MH 2004, ‘Analytical approaches for optimal placement of dg sources in power systems’, IEEE Transaction on Power System, vol. 19, no. 4, pp. 2068-2076. 4.Das, D, Kothari, DP & Kalam, A 1995, ‘Simple and efficient method for load flow solution of Industry Applications objective focussed allocation’, IEEE @ IJTSRD | Available Online @ www.ijtsrd.com | Volume – 3 | Issue – 1 | Nov-Dec 2018 Page: 802
International Journal of Trend in Scientific Research and Development (IJTSRD) ISSN: 2456-6470 14.Srinivasa Rao, R & Narasimham, SVL 2008, ‘Optimal capacitor placement in a radial distribution system using plant growth simulation algorithm’, World Engineering and Technology, vol. 2, pp. 9. 15.Aghaebrahimi, MR, Amiri, M & Zahiri, ZH 2009, ‘An immune-based optimization method for distributed generation placement in order to minimize power losses, Conference on Sustainable Power Generation and Supply (SUPERGEN), Nanjing, China. 16.Moradi, MH & Abedini, M 2012, ‘A combination of genetic algorithm and particle swarm algorithm optimization for optimal DG location and sizing in distribution systems’, International Journal of Electrical Power and Energy Systems, vol. 34, pp. 66-74. 17.Abou El-Ela, AA, Allam, SM & Shatla, MM 2010, ‘Maximal optimal benefits of distributed generation using genetic algorithms’, Electric Power Systems Research, vol. 80, pp. 869-877. Academy of Science, 1st International @ IJTSRD | Available Online @ www.ijtsrd.com | Volume – 3 | Issue – 1 | Nov-Dec 2018 Page: 803