Download
1 / 7
70 likes | 70 Views
Selecting a student for all round excellent award is based on a complex, elaborate combination of abilities and skills. A multi criteria Decision Making method, AHP is used to help in making decision consistently by doing a pairwise comparison matrix process between criteria based on selected alternatives and determining the priority order of criteria and alternatives used. The results of these calculations are used to determine the outstanding student receiving a scholarship based on the final results of the AHP method calculation. The results demonstrated that the student ranking is more likely influenced by the relative importance of management, leadership and motivation by sub criteria, education, cooperation, innovation, disciplinary, attendance, knowledge, sports activity, social activity and awards. Kyi Kyi Mynit "Multi Criteria Decision Making Methodology on Selection of a Student for All Round Excellent Award" Published in International Journal of Trend in Scientific Research and Development (ijtsrd), ISSN: 2456-6470, Volume-3 | Issue-5 , August 2019, URL: https://www.ijtsrd.com/papers/ijtsrd26428.pdf Paper URL: https://www.ijtsrd.com/management/research-method/26428/multi-criteria-decision-making-methodology-on-selection-of-a-student-for-all-round-excellent-award/kyi-kyi-mynit<br>

E N D
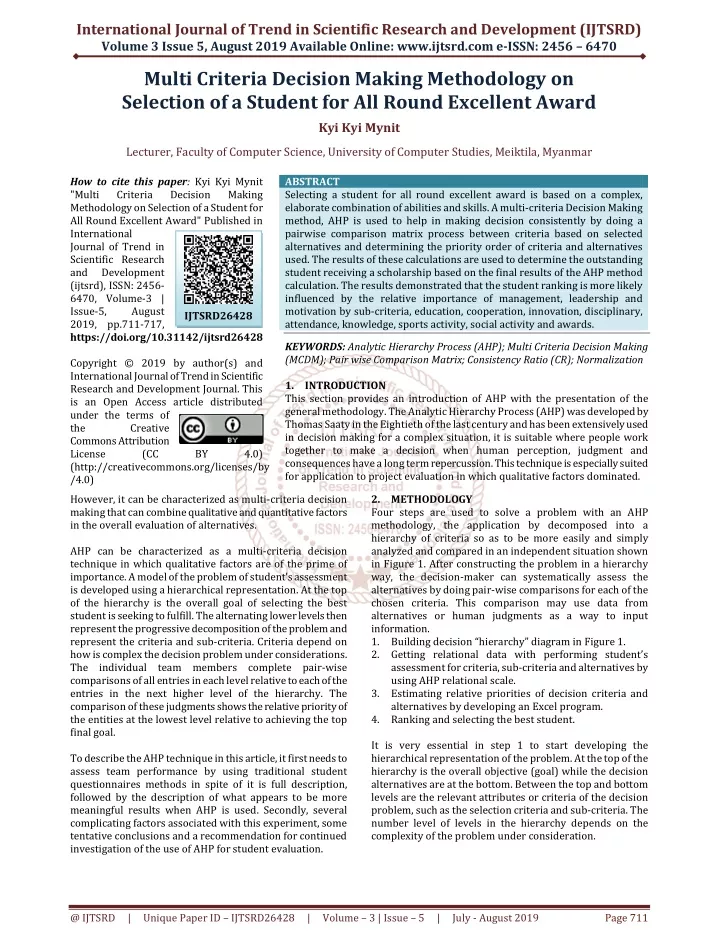
International Journal of Trend in Scientific Research and Development (IJTSRD) Volume 3 Issue 5, August 2019 Available Online: www.ijtsrd.com e-ISSN: 2456 – 6470 Multi Criteria Decision Making Methodology on Selection of a Student for All Round Excellent Award Kyi Kyi Mynit Lecturer, Faculty of Computer Science, University of Computer Studies, Meiktila, Myanmar How to cite this paper: Kyi Kyi Mynit "Multi Criteria Methodology on Selection of a Student for All Round Excellent Award" Published in International Journal of Trend in Scientific Research and Development (ijtsrd), ISSN: 2456- 6470, Volume-3 | Issue-5, August 2019, pp.711-717, https://doi.org/10.31142/ijtsrd26428 Copyright © 2019 by author(s) and International Journal of Trend in Scientific Research and Development Journal. This is an Open Access article distributed under the terms of the Creative Commons Attribution License (CC (http://creativecommons.org/licenses/by /4.0) However, it can be characterized as multi-criteria decision making that can combine qualitative and quantitative factors in the overall evaluation of alternatives. AHP can be characterized as a multi-criteria decision technique in which qualitative factors are of the prime of importance. A model of the problem of student's assessment is developed using a hierarchical representation. At the top of the hierarchy is the overall goal of selecting the best student is seeking to fulfill. The alternating lower levels then represent the progressive decomposition of the problem and represent the criteria and sub-criteria. Criteria depend on how is complex the decision problem under considerations. The individual team members complete pair-wise comparisons of all entries in each level relative to each of the entries in the next higher level of the hierarchy. The comparison of these judgments shows the relative priority of the entities at the lowest level relative to achieving the top final goal. To describe the AHP technique in this article, it first needs to assess team performance by using traditional student questionnaires methods in spite of it is full description, followed by the description of what appears to be more meaningful results when AHP is used. Secondly, several complicating factors associated with this experiment, some tentative conclusions and a recommendation for continued investigation of the use of AHP for student evaluation. ABSTRACT Selecting a student for all round excellent award is based on a complex, elaborate combination of abilities and skills. A multi-criteria Decision Making method, AHP is used to help in making decision consistently by doing a pairwise comparison matrix process between criteria based on selected alternatives and determining the priority order of criteria and alternatives used. The results of these calculations are used to determine the outstanding student receiving a scholarship based on the final results of the AHP method calculation. The results demonstrated that the student ranking is more likely influenced by the relative importance of management, leadership and motivation by sub-criteria, education, cooperation, innovation, disciplinary, attendance, knowledge, sports activity, social activity and awards. KEYWORDS: Analytic Hierarchy Process (AHP); Multi Criteria Decision Making (MCDM); Pair wise Comparison Matrix; Consistency Ratio (CR); Normalization 1.INTRODUCTION This section provides an introduction of AHP with the presentation of the general methodology. The Analytic Hierarchy Process (AHP) was developed by Thomas Saaty in the Eightieth of the last century and has been extensively used in decision making for a complex situation, it is suitable where people work together to make a decision when human perception, judgment and consequences have a long term repercussion. This technique is especially suited for application to project evaluation in which qualitative factors dominated. Decision Making IJTSRD26428 BY 4.0) 2.METHODOLOGY Four steps are used to solve a problem with an AHP methodology, the application by decomposed into a hierarchy of criteria so as to be more easily and simply analyzed and compared in an independent situation shown in Figure 1. After constructing the problem in a hierarchy way, the decision-maker can systematically assess the alternatives by doing pair-wise comparisons for each of the chosen criteria. This comparison may use data from alternatives or human judgments as a way to input information. 1.Building decision “hierarchy” diagram in Figure 1. 2.Getting relational data with performing student’s assessment for criteria, sub-criteria and alternatives by using AHP relational scale. 3.Estimating relative priorities of decision criteria and alternatives by developing an Excel program. 4.Ranking and selecting the best student. It is very essential in step 1 to start developing the hierarchical representation of the problem. At the top of the hierarchy is the overall objective (goal) while the decision alternatives are at the bottom. Between the top and bottom levels are the relevant attributes or criteria of the decision problem, such as the selection criteria and sub-criteria. The number level of levels in the hierarchy depends on the complexity of the problem under consideration. @ IJTSRD | Unique Paper ID – IJTSRD26428 | Volume – 3 | Issue – 5 | July - August 2019 Page 711
International Journal of Trend in Scientific Research and Development (IJTSRD) @ www.ijtsrd.com eISSN: 2456-6470 alternative is calculated. The probability determines the likelihood that the alternative has to achieve the expected goal. The high the probability, the better chances the alternative has to satisfy the final goal. The priorities (or weight) of the lowest level alternatives relative to the top objective are determined and displayed. AHP facilitates a comprehensive and logical analysis of problems for which considerable uncertainty exists. In fact, the power of AHP (and to a large degree is uniqueness) is the ability to consider qualitative goal and attributes within its framework. Generally speaking, the mathematical calculation involved in the AHP may seem simple at first, but if dealing with a more complex scenario, the calculations become more complicated. 3.DEVELOPMENT AND RESEARCH OF METHODS FOR SELECTING THE BEST STUDENT A.Defining the pairwise comparison matrix of the student by focusing on sub-criteria Supervisors and the students work together to get the comparison matrix after considering the hierarchy structure for achieving the final goal. The student did of all comparisons for all sub- criteria education, cooperation, innovation, disciplinary, attendance, knowledge, sports activity, social activity and awards. If the consistency ratio (CR) of their comparisons were significantly high, supervisors need to rearrange student's assessment to get the proper CR [9-11]. Comparison matrix and eigenvector are presented in TABLE II-IX. Table.2 Comparison matrix for focusing student’s education Education S1 S1 1 S2 0.3333 S3 0.1667 0.5 S4 1 S5 0.25 Sum 2.75 Figure.1: AHP example of approaching goal for selecting an outstanding student. Table.1 Numerical relational scale Intensity of important 1 3 5 7 9 2,4,6,8 Definition Equal importance More importance Much More importance Very Much More strong Extremely More importance Intermediate values At step 2, we need to gather data to compare the alternatives. The decision-maker has to make pair-wise comparisons of criteria at each level relative to each activity at the next adjacent higher level in the hierarchy. In AHP, a relational scale of numbers from 1 to 9 is used to systematically assign preferences. When comparing two attributes, A and B, with respect to GOAL in a higher level, the numerical relational scale is used as shown in TABLE I. In step 3, the pair-wise comparison matrix can be created by using the Eigenvalue method in step 2. These Eigenvalues can be determined the relative priority of each attribute to each attribute level up in the hierarchy. The method of pairwise comparisons is systematic and comprehensive. One might want to repeat a set of pairwise comparison if the consistency ratio is alarmingly high. In spite of the decision- maker has the option of redoing the comparison matrix if desired to improve the consistency. In step 4, after all comparisons have been made, and the relative weights between each one of the criteria to be evaluated have been found, the numerical probability of each S2 3 1 S3 6 2 1 4 1 14 S4 1 0.5 0.25 1 0.25 3 S5 4 2 1 4 1 12 2 0.5 7 Table.3 Normalization comparison matrix and eigenvector (CR=0.0059) Normalization S1 S2 S3 S1 0.3636 0.4286 0.4286 0.3333 0.3333 S2 0.1212 0.1429 0.1429 0.1667 0.1667 S3 0.0606 0.0714 0.0714 0.0833 0.0833 S4 0.3636 0.2857 0.2857 0.3333 0.3333 S5 0.0909 0.0714 0.0714 0.0833 0.0833 S4 S5 Eigen Vector 0.3775 0.1481 0.0740 0.3203 0.0801 Table.4 Comparison matrix for focusing student’s cooperation Co-operation S1 S1 1 S2 2 S3 0.33 0.167 S4 0.5 0.25 S5 4 Sum 7.83 2.417 17 11.5 S2 0.5 1 S3 3 6 1 2 5 S4 2 4 0.5 1 4 S5 0.25 2 0.2 0.25 1 3.7 0.5 @ IJTSRD | Unique Paper ID – IJTSRD26428 | Volume – 3 | Issue – 5 | July - August 2019 Page 712
International Journal of Trend in Scientific Research and Development (IJTSRD) @ www.ijtsrd.com eISSN: 2456-6470 Table.5 Normalization comparison matrix and eigenvector (CR=0.0396) Normalization S1 S2 S3 S1 0.1277 0.2069 0.1765 0.1739 0.0676 S2 0.2553 0.4138 0.3529 0.3478 0.5405 S3 0.0426 0.0690 0.0588 0.0435 0.0541 S4 0.0638 0.1034 0.1176 0.0870 0.0676 S5 0.5106 0.2069 0.2941 0.3478 0.2703 S4 S5 Eigen Vector 0.1505 0.3821 0.0536 0.0879 0.3259 Table.6 Comparison matrix for focusing student’s innovation Innovation S1 S2 S1 1 4 S2 0.25 1 S3 4 5 S4 2 4 S5 0.2 1 Sum 7.45 15 2.117 3.95 18 S3 0.25 0.2 1 0.5 0.167 S4 0.5 0.25 2 1 0.2 S5 5 1 6 5 1 Table.7 Normalization comparison matrix and eigenvector (CR=0.0404)N Normalization S1 S2 S3 S1 0.1342 0.2667 0.1181 0.1266 0.2778 S2 0.0336 0.0667 0.0945 0.0633 0.0556 S3 0.5369 0.3333 0.4724 0.5063 0.3333 S4 0.2685 0.2667 0.2362 0.2532 0.2778 S5 0.0268 0.0667 0.0787 0.0506 0.0556 S4 S5 Eigen Vector 0.1847 0.0627 0.4365 0.2605 0.0557 Table.8 Comparison matrix for focusing student’s disciplinary Disciplinary S1 S1 1 S2 4 S3 0.333 0.167 S4 2 S5 0.25 Sum 7.583 2.117 13 4.25 15 Table.9 Normalization comparison matrix and eigenvector (CR=0.0412)N Normalization S1 S2 S3 S1 0.132 0.118 0.231 0.117 0.267 S2 0.528 0.472 0.462 0.471 0.333 S3 0.044 0.079 0.078 0.118 0.067 S4 0.264 0.236 0.154 0.235 0.267 S5 0.033 0.095 0.077 0.059 0.067 Table.10 Comparison matrix for focusing student’s attendance Attendance S1 S2 S1 1 3 S2 0.33 1 S3 2 4 S4 0.5 1 S5 4 5 Sum 7.83 14 S2 0.25 1 S3 3 6 1 2 1 S4 0.5 2 0.50 1 0.25 S5 4 5 1 4 1 0.5 0.2 S4 S5 Eigen Vector 0.1730 0.4531 0.0768 0.2312 0.0660 S3 0.5 0.25 1 0.25 1 3 S4 2 1 4.00 1 4 12 S5 0.25 0.2 1 0.25 1 2.7 Table.11 Normalization comparison matrix and eigenvector (CR=0.0197)N Normalization S1 S2 S3 S1 0.128 0.2143 0.167 0.1667 0.0926 S2 0.0426 0.0714 0.083 0.0833 0.0741 S3 0.2553 0.2857 0.333 0.3333 0.3704 S4 0.0638 0.0714 0.083 0.0833 0.0926 S5 0.5106 0.3571 0.333 0.3333 0.3704 S4 S5 Eigen Vector 0.1536 0.0709 0.3156 0.0789 0.3810 @ IJTSRD | Unique Paper ID – IJTSRD26428 | Volume – 3 | Issue – 5 | July - August 2019 Page 713
International Journal of Trend in Scientific Research and Development (IJTSRD) @ www.ijtsrd.com eISSN: 2456-6470 Table.12 Comparison matrix for focusing student’s general knowledge Knowledge S1 S2 S1 1 S2 0.2 S3 0.25 S4 0.33 0.5 S5 1 Sum 2.78 12.5 12 Table.13 Normalization comparison matrix and eigenvector (CR=0.0625)N Normalization S1 S2 S3 S1 0.3593 0.4000 0.3333 0.3529 0.3390 S2 0.0719 0.0800 0.0833 0.2353 0.0678 S3 0.0898 0.0800 0.0833 0.0588 0.0847 S4 0.1198 0.0400 0.1667 0.1176 0.1695 S5 0.3593 0.4000 0.3333 0.2353 0.3390 Table.14 Comparison matrix for focusing student’s sport activity Sport S1 S2 S1 1 3 S2 0.333 1 S3 0.5 0.5 S4 0.5 1 S5 1 2 Sum 3.33 7.5 S3 4 1 1 2 4 S4 3 2 0.50 0.25 1 2 8.5 S5 1 0.2 5 1 1 0.5 1 2.95 5 S4 S5 Eigen Vector 0.3569 0.1077 0.0793 0.1227 0.3334 S3 S4 2 2 1 1 2 8 S5 1 0.5 0.5 1 1 4 2 1 1 1 1 6 Table.15 Normalization comparison matrix and eigenvector (CR=0.0358) Normalization S1 S2 S3 S1 0.3000 0.40 0.25 S2 0.100 0.133 0.25 S3 0.150 0.067 0.125 S4 0.150 0.133 0.125 S5 0.30 0.267 0.25 Table.16 Comparison matrix for focusing student’s social activity Social S1 S2 S1 1 4 S2 0.25 1 S3 0.5 2 S4 0.33 1 S5 0.5 2 Sum 2.583 10 S4 S5 0.25 0.125 0.125 0.25 0.25 Eigen Vector 0.3067 0.1550 0.1267 0.1650 0.2467 0.3333 0.167 0.167 0.167 0.167 S3 2 0.5 1 0.5 1 5 S4 3 1 2.00 1 2 9 S5 2 0.5 1 0.5 1 5 Table.17 Normalization comparison matrix and eigenvector (CR=0.0022) Normalization S1 S2 S1 0.3871 0.40 S2 0.0968 0.10 S3 0.1935 0.20 S4 0.1290 0.100 S5 0.1935 0.2 S3 0.40 0.33 0.40 0.10 0.11 0.10 0.20 0.22 0.20 0.1 0.11 0.10 0.2 0.2 S4 S5 Eigen Vector 0.3841 0.1016 0.2032 0.1080 0.2032 0.2 Table.18 Comparison matrix for focusing student’s awards Award S1 S2 S1 1 2 S2 0.5 1 S3 2 4 S4 4 6 S5 4 5 Sum 11.5 18 5.75 2.917 2.95 S3 0.5 0.25 0.167 1 2 2 S4 0.25 S5 0.25 0.2 0.5 1 1 0.50 1 1 @ IJTSRD | Unique Paper ID – IJTSRD26428 | Volume – 3 | Issue – 5 | July - August 2019 Page 714
International Journal of Trend in Scientific Research and Development (IJTSRD) @ www.ijtsrd.com eISSN: 2456-6470 Table.19 Normalization comparison matrix and eigenvector (CR=0.0058) Normalization S1 S2 S1 0.0870 0.1111 0.087 0.086 0.0847 S2 0.0435 0.0556 0.044 0.057 0.0678 S3 0.1739 0.2222 0.174 0.171 0.1695 S4 0.3478 0.3333 0.348 0.343 0.3390 S5 0.3478 0.2778 0.348 0.343 0.3390 S3 S4 S5 Eigen Vector 0.0911 0.0535 0.1822 0.3422 0.3311 In order to find Eigenvalues for each alternative by focusing each sub-criterion, it is necessary to normalize each comparison Matrix by dividing each table value by the total column (TABLE III, V, VII, IX, XI, XIII, XV, XVII, and XIX). B.Defining a comparison matrix of sub-criteria by focusing criteria The definition of sub-criteria is presented in TABLE XX. Firstly, we need to get comparison matrix of sub-criteria by calculating each sufficient CR values. Then, the Eigenvector of these sub-criteria by focusing criteria can be calculated after normalizing each comparison matrix of sub-criteria by dividing each column values. Table.20 Definition of sub-criteria C1 Education C2 Co-operation C3 Innovation C4 Disciplinary C5 Attendance C6 General knowledge C7 Sport activity C8 Social activity C9 Awards The values found in the Eigenvector have a direct physical meaning in the AHP technique. They determine the weight of those criteria relative to the total result of the goal. The Eigenvector shows the relative weights between each criterion by calculating the arithmetic average of all criteria. So, we can observe that the sum of all values from the vector is always equal to one. The relative weight values of the comparison matrix of sub-criteria by focusing on each criteria Management, Leadership and Motivation and its overall weight vector are presented in TABLE XXI. Table.21 Relative weight of criteria and overall Eigenvector CRITERIA Management Leadership Motivation Eigen Vector C1 0.2893 0.2414 C2 0.0528 0.1594 C3 0.1640 0.1229 C4 0.0603 0.1488 C5 0.1847 0.0656 C6 0.0811 0.1021 C7 0.0317 0.0411 C8 0.0345 0.0429 C9 0.1016 0.0759 Total 1.0000 1.0000 The results are showing that C1 (education) and C3 (innovation) sub-criteria are higher and C7 (sports activity) and C8 (social activity) are lower values relative to the other sub-criteria. This means that higher weight values have a higher priority to achieving the final goal. Comparing result weight values are presented in Figure 2. 0.2238 0.1049 0.1939 0.0506 0.1666 0.0790 0.0403 0.0427 0.0982 1.0000 0.2515 0.1057 0.1603 0.0865 0.1389 0.0874 0.0377 0.0400 0.0919 1.0000 Figure .2: Priorities of sub-criteria by focusing third level criteria. @ IJTSRD | Unique Paper ID – IJTSRD26428 | Volume – 3 | Issue – 5 | July - August 2019 Page 715
International Journal of Trend in Scientific Research and Development (IJTSRD) @ www.ijtsrd.com eISSN: 2456-6470 C.Ranking The overall priorities to each individual student can find after completed all pairwise comparisons to the low level of the hierarchy. The low level consists of nine sub-criteria, co-operation, innovation, disciplinary, attendance, knowledge, sports activity, social activity and awards, as illustrated above in Figure 3. Figure .3: Overall priorities of five students The results appear in TABLE XXII indicate that the perceived relative importance of criteria determinate varies from one student to another. This finding and the above reveals that there are a number of attributes that are of particular importance to students to decide their contribution regardless of past doing. Such students’ attributes mainly pertain to personnel differences. TABLE XVIII show that S1 takes the highest priority [0.2433], S4 has gotten [0.2153], while S3 gets [0.1813] and S2 gets the lower priority [0.161]. So that, if we assume that S1 deserves excellent grade [95], however, this will help us to assign a grade to other individual students as, [90, 84, 75 and 65] to S4, S5, S3 and S2 respectively. Table.22 Ranking of selecting excellent student Alternatives Ranking S1 S2 S3 S4 S5 4.CONCLUSION This is a good exercise of selecting the best student in many ways. The use of co-operative learning was a good educational experience between students and supervisors. The main conclusions in this article are: 1.The structured approach AHP technique is used to perform problem formulation by seeking student's opinions. 2.The student's assessments have an important role in performing multi-criteria decision making analysis and expert choice. 3.All results are carried out by developing a software medium based on Microsoft Excel. 4.The results are showing that the perceived relative importance of criteria vary from one to another. The relative weight values of criteria are education [0.2515], cooperation [0.1057], innovation [0.1603], disciplinary [0.0865], attendance [0.1389], knowledge [0.0874], sport activity [0.0377], social activity [0.0400] and awards [0.0919]. 5.The results also reveal in order of priority, S1 [0.2433], S4 [0.2153], S5 [0.1992], S3 [0.1813] and S2 [0.161]. 6.Finally, the article opens the door for further studies to enhance the learning and teaching process at high education institutes. REFERENCES [1]Saaty, Thomas, L., (1980), “The Analytical Hierarchy Process”, McGraw-Hill Co., New York. [2]Saaty, Thomas, L., (1990),” How to Make a Decision: The AnalyticalHierarchy Process”, European Journal of Operations Research, 48, pp 9-26. [3]Bhushan, N. & Rai, K. (2004) Strategic Decision Making: Applying the Analytic Hierarchy Process., New York: Springer. 0.2433 0.1610 0.1813 0.2153 0.1992 [4]Al Harbi K.M, A, S,(1999), Application of AHP in Project Management, International Journal of Project Management, 19 19-27. [5]Saaty, T. (2008), Relative Measurement and its Generalization in Decision Making: Why Pairwise Comparisons are Central in Mathematics for the Measurement of Intangible Factors- the Analytic Hierarchy/Network Process. Madrid: Review of the Royal Spanish Academy of Science, Series A, Mathematics. http://www.rac.es/ficheros/doc/00576.pdf [6]Saaty, T. (2005), Theory and Application of the Analytic Network Process: Decision Making with Benefits, Opportunities, Cost and Risks. Pittsburg: RWS Publications. [7]Haas R., Meixner, O., (2009) An Illustration Guide to the AHP, Lecture Notes, Institute of Marketing & Innovation, University of Natural Resources and http:www.boku.ac.at/mi/ @ IJTSRD | Unique Paper ID – IJTSRD26428 | Volume – 3 | Issue – 5 | July - August 2019 Page 716
International Journal of Trend in Scientific Research and Development (IJTSRD) @ www.ijtsrd.com eISSN: 2456-6470 [8]Saaty, T.L., Vargas, L. G., (2001), Models, Methods, Concepts & Applications of the AHP, Kluwer’s Academic Publishers, Boston, USA. using Simple Additive Weighting (SAW),” Int. J. Comput. Appl., vol. 151, pp. 10–13, 2016. [15]N. G. A. P. H. Saptarini and Putu Manik Prihatini, “Decision Support System For Scholarship in Bali state PolyTechnic Using AHP and TOPSIS,” Int. Conf. Inf. Technol. Bus., pp. 38–46, 2015. [9]A. Toloie Eshlaghy et al, Sensitivity analysis for criteria values in decision-making matrix of saw method. International Journal of Industrial Mathematics, 1, 69- 75, 2009. [16]S. Chakraborty and C.-H. Yeh, “A Simulation-Based Comparative Study of Normalization Procedures in Multiattribute Decision Making,” in Int. Conf. on Artificial Intelligence, Knowledge Engineering and Data Bases, 2007, pp. 102–109. [10]Vargas, L.G. (1990) An Overview of the Analytic Hierarchy Process and its Application. European Journal of Operation Research, 48, 2-8. [11]Vargas, L.G. (2010) Using the Analytic Hierarchy Process (AHP) to Select and Prioritize Project in a Portfolio. [17]S. Chakraborty and C.-H. Yeh, “A Simulation Comparison of Normalization Procedures for TOPSIS,” Comput. Ind. Eng., pp. 1815–1820, 2009. [12]Wibowo H and et al, “Decision Support System To Determine Scholarship Bank BRI Using FMADM (Case Study: Students of the Faculty of Industrial Technology Universities Islam Indonesia).,” Proceeding of SNATI, pp. 62–67, 2009. [18]S. Chakraborty and C.-H. Yeh, “Rank Similarity-based MADM Method Selection,” in International Conference on Statistics in Science, Business and Engineering (ICSSBE2012), 2012. [13]Glenn Bowen, “Service Learning in the Scholarship of Teaching and Learning: Effective Practices,” Int. J. Scholarsh. Teach. Learn., vol. 4, pp. 1–15, 2010. [19]A. S. Milani, A. Shanian, R. Madoliat, and J. A. Nemes, “The effect of normalization norms in multiple attribute decision-making models: a case study in gear material selection,” Struct. Multidiscip. Optim., vol. 29, no. 4, pp. 312–318, Sep. 2004. [14]Muhamad Ibrahim and Sumiati, “Decision Support System for Determining the Scholarship Recipients @ IJTSRD | Unique Paper ID – IJTSRD26428 | Volume – 3 | Issue – 5 | July - August 2019 Page 717