Download
1 / 9
90 likes | 102 Views
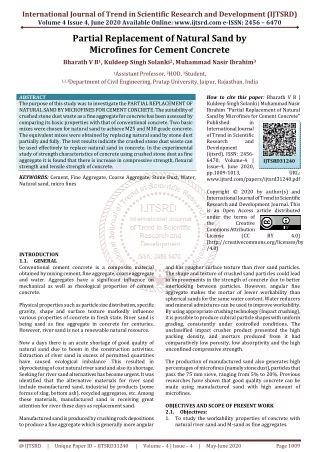
At the present scenario, the Lean Manufacturing has become a worldwide phenomenon. A large number of organizations are following Lean technologies and experiencing vast improvement in quality, production, customer service and profitability. Muththamizh industries in Palani is a manufacturing company that manufactures variety of agricultural oriented machines. In this work to adopt the Lean manufacturing concept in this industry by using Value Stream Mapping VSM technique and to reduce the wastes such as long lead time, defects, material waste etc. Our project focuses on creating current and future state value stream maps which, when implemented will decrease the current lead time of manufacturing thereby improving the productivity of industrial shop floor. From their products, the team chose Chaff cutter machine as a product family and worked on them. From the Current Value Stream Map created the lead time for the product is found to be 3 to 3.34 days right from the processing of raw materials till the product is ready to be shipped. From the map created, various stages that contains bottlenecks in production were clearly identified and remedial measures were taken to eliminate those bottlenecks. Various lean tools such as Kaizen Bursts, 5S and other methods to eliminate the wastes were identified and implemented effectively. After remedial measures were adopted the data is tracked again and Future Value Stream Map is drawn. From the map it was clear that the lead time for the product was reduced to a certain extent of up to 4 hours. Therefore our primary goal of the object was achieved by adopting lean techniques and the productivity and efficiency of the organization was increased. G. Saravanan | R. Karthikeyan | S. Mohamed Nasrulla "Productivity Improvement using Lean Manufacturing A Case Study at Muththamizh Industries" Published in International Journal of Trend in Scientific Research and Development (ijtsrd), ISSN: 2456-6470, Volume-2 | Issue-4 , June 2018, URL: https://www.ijtsrd.com/papers/ijtsrd12836.pdf Paper URL: https://www.ijtsrd.com/engineering/mechanical-engineering/12836/productivity-improvement-using-lean-manufacturing-u2013-a-case-study-at-muththamizh-industries/g-saravanan<br>

E N D
International Research Research and Development (IJTSRD) International Open Access Journal Productivity Improvement using Lean Manufacturing A Case Study at Muththamizh Industries A Case Study at Muththamizh Industries International Journal of Trend in Scientific Scientific (IJTSRD) International Open Access Journal ISSN No: 2456 ISSN No: 2456 - 6470 | www.ijtsrd.com | Volume 6470 | www.ijtsrd.com | Volume - 2 | Issue – 4 Productivity Improvement using Lean Manufacturing – A Case Study at Muththamizh Industries Productivity Improvement using Lean Manufacturing G. Saravanan, R. Karthikeyan, S. Mohamed Nasrulla Assistant Professor, Department of Mechanical Engineering, G. Saravanan, R. Karthikeyan, S. Mohamed Nasrulla Assistant Professor, Department of Mechanical Engineering, PSNA College of Engineering and Technology, Dindigul, Tamil Nadu PSNA College of Engineering and Technology, Dindigul, Tamil Nadu PSNA College of Engineering and Technology, Dindigul, Tamil Nadu, India ABSTRACT At the present scenario, the Lean Manufacturing has become a worldwide phenomenon. A large number of organizations are following Lean technologies and experiencing vast improvement in quality, production, customer service and profitability. industries in Palani is a manufacturing company that manufactures variety of machines. In this work to adopt the Lean manufacturing concept in this industry by using Stream Mapping (VSM) technique and to reduce the wastes such as long lead time, defects, material waste etc. Our project focuses on creating current and future state value stream maps which, when implemented will decrease the current lead time of ma thereby improving the productivity of industrial shop floor. productivity and efficiency of the organization was productivity and efficiency of the organization was increased. At the present scenario, the Lean Manufacturing has become a worldwide phenomenon. A large number of organizations are following Lean technologies and Keywords: Lean manufacturing, 5s, VSM, Kaizen : Lean manufacturing, 5s, VSM, Kaizen quality, production, Muththamizh 1.INTRODUCTION: industries in Palani is a manufacturing company that manufactures variety of machines. In this work to adopt the Lean manufacturing concept in this industry by using Value Stream Mapping (VSM) technique and to reduce the wastes such as long lead time, defects, material waste etc. Our project focuses on creating current and future state value stream maps which, when implemented will decrease the current lead time of manufacturing thereby improving the productivity of industrial shop agricultural agricultural oriented oriented With manufacturing becoming a more and more competitive market, companies globally strive to increase their efficiency. Increasing labor costs in many industrialized countries, as well as reducing and controlling operating costs, are just a few reasons panies choose to move or outsource their operations. Typically a majority of companies outsource to countries where wages are low and production costs are lower. To reduce cost and remain competitive with manufacturers abroad, companies fferent methods. One of the main methods is called “lean manufacturing.” The main principle of lean manufacturing is to reduce waste in an operation, such as long lead times, defects and material waste. In order to visually display where e process, a value stream map (VSM) is drawn. VSMs are often used to assess current manufacturing processes as well as create ideal, future state processes. With the manufacturing field escalating and spreading more widely across the for companies to adapt to the With manufacturing becoming a more and more competitive market, companies globally strive to increase their efficiency. Increasing labor costs in many industrialized countries, as well as reducing and controlling operating costs, are just a few reasons companies choose to move or outsource their operations. Typically a majority of companies outsource to countries where wages are low and production costs are lower. To reduce cost and remain competitive with manufacturers abroad, companies use a variety of different methods. One of the main methods is called “lean manufacturing.” The main principle of lean manufacturing is to reduce waste in an operation, such as long lead times, defects and material waste. In order to visually display where waste occurs in the process, a value stream map (VSM) is drawn. VSMs are often used to assess current manufacturing processes as well as create ideal, future state processes. With the manufacturing field escalating and spreading more widely across the globe, it is important for companies to adapt to the increasing and evolving business strategies. increasing and evolving business strategies. From their products, the team chose Chaff cutter machine as a product family and worked on them. From the Current Value Stream Map created the lead time for the product is found to be 3 to 3.34 days right from the processing of raw materials till the product is ready to be shipped. From the map created, various stages that contains bottlenecks in production were clearly identified and remedial measures were taken to eliminate those bottlenecks. Various lean tools such as Kaizen Bursts, 5S and other methods to eliminate the wastes were identified and implemented effectively. After remedial measures were adopted the data is tracked again and Future Value Stream Map is drawn. From the map it was clear that the lead time for the product was reduced to a certain extent of up to 4 hours. Therefore our primary goal of the object was achieved by adopting lean techniques and the was achieved by adopting lean techniques and the From their products, the team chose Chaff cutter machine as a product family and worked on them. From the Current Value Stream Map created the lead e 3 to 3.34 days right from the processing of raw materials till the product is ready to be shipped. From the map created, various stages that contains bottlenecks in production were clearly identified and remedial measures were taken ttlenecks. Various lean tools such as Kaizen Bursts, 5S and other methods to eliminate the wastes were identified and implemented effectively. After remedial measures were adopted the data is tracked again and Future Value Stream Map is it was clear that the lead time for the product was reduced to a certain extent of up to 4 hours. Therefore our primary goal of the object For this project we worked with the manufacturing company, Muththamizh Dharapuram Road, Palani. We focused on the company’s main product, the “Chaff Cutter” tha used in agricultural fields. A used in agricultural fields. A chaff cutter is a For this project we worked with the manufacturing company, Muththamizh Dharapuram Road, Palani. We focused on the company’s main product, the “Chaff Cutter” that are Industries, Industries, in in New New @ IJTSRD | Available Online @ www.ijtsrd.com @ IJTSRD | Available Online @ www.ijtsrd.com | Volume – 2 | Issue – 4 | May-Jun Jun 2018 Page: 107
International Journal of Trend in Scientific Research and Development (IJTSRD) ISSN: 2456-6470 mechanical device for cutting straw or hay into small pieces before being mixed together with other forage and fed to horses and cattle.. Muththamizh Industries manufacture this machine in different sizes, based on the requirement of the customer. In the industry the whole product is manufactured within itself, that is all operation required to form the complete product was within. The total lead time right from the procurement of raw materials till the finished product is quality checked is about 3.34 days. In order to create a lean working environment, these wastes need to be identified and depleted. The first muda is overproduction, which is producing more than necessary, or more than is needed by the costumer. The second muda is the presence of defects. Defects in products lead to more costs and waste of production time, as well as the effort involved in inspecting and fixing defects. The third waste is inventory. Inventory could lead to added storage costs as well as higher defect rates. Even if there is no “inventory fee,” large inventories cost company money because it increases their operating costs. The fourth muda is transportation, which could be transporting goods from one factory to another. Transportation, strictly seen, is a non-value added activity, so companies strive to lower transportation distances. The fifth muda, waiting, is very important to lean manufacturing because this is one of the main wastes that production companies want to minimize. Waiting causes waste of time and money. The sixth waste is over processing. Over processing is unintentionally doing more processing work than the customer requires, which can lead to higher costs by using more resources than needed. The final waste is unnecessary motion. Walking from operation to operation or around the factory floor when not necessary, slows down the workers and overall slows down the flow of production (Mekong, 2004). Detecting and diminishing these wastes within the production process will overall help to create a lean working environment within a company. With the initial project research and further investigation, the team found out that the Value stream mapping has so far not been used by the industry as a tool for operational improvements. The team efforts were the first in that direction. Our primary project goal was to reduce the current lead time by at least 20% In order to achieve that goal, we had to document the current state of the production process. With the creation of an initial and final state VSM, we were able to draw conclusions based on the research and data we accumulated, and we were able to achieve the primary goal of the project. We achieved these operational improvements through the optimization of delivery times and inventory levels and also reduced the total lead time. 2.LITERATURE REVIEW Starting in the early 1900’s Henry Ford “married consistently interchangeable parts with standard work and moved conveyance to create what he called flow production.” Not soon after WWI the Toyota Production System, TPS, manufacturing concepts into the manufacturing industry (“A Brief History of Lean” 2007). 3.LEAN MANUFACTURING introduced lean Lean manufacturing or lean production, often simply "lean", is a systematic method for waste minimization within a manufacturing system without sacrificing productivity. perspective of the client who consumes a product or service, "value" is any action or process that a customer would be willing to pay for. Lean manufacturing makes obvious what adds value, by reducing everything else (which is not adding value). Lean Manufacturing has increasingly been applied by leading manufacturing companies throughout the world. It has proven to have many positive outcomes which include such concepts as reduced cycle time, decreased cost, reduction of defects and waste. Lean manufacturing aims to achieve the same output with less input; such as less time, less space, less human effort, less machinery, less material and less cost. To better understand lean manufacturing, one first needs to understand the basic principles that guide it. Some major lean manufacturing recognizing wastes, having standard processes, having a continuous flow, pull-production, quality at the source and maintaining continuous improvement. Working from the Lean strategy for achieving excellence: Manufacturing is an enterprise-wide by principles include: creating value (from the customer's perspective) by creating a culture of continuous performance improvement and working to eliminate all waste of resources and time According to the TPS, there are seven original wastes known as “muda,” which means “waste” in Japanese. @ IJTSRD | Available Online @ www.ijtsrd.com | Volume – 2 | Issue – 4 | May-Jun 2018 Page: 108
International Journal of Trend in Scientific Research and Development (IJTSRD) ISSN: 2456-6470 By creating high quality, stable processes and emphasizing respect for people throughout the organization. on reduction of the original Toyota seven wastes to improve overall customer value. The steady growth of Toyota, from a small company to the world's largest automaker, has focused attention on how it has achieved this success. Table 3.1shows the difference in between Lean Manufacturing Vs Traditional Manufacturing. Traditional manufacturing This management philosophy is derived mostly from the Toyota Production System (TPS) and identified as "lean" only in the 1990s.TPS is renowned for its focus Aspect Lean manufacturing No of equipment and people High Less Factory space for same output High Less Work in progress High Less Defects High Less Operational availability Less High Production lead time High Less Inventory Inventory is good Inventory is waste System schedule Push system scheduled internally Pull system scheduled by customer requirements Focus on Non-Value-Waste elimination Direct labour is a small percentage of total labor cost Short cycle time Focus Focus on Value- Add improvement Direct labour cost High direct labour cost Cycle time Long cycle time Inventory level High inventory levels Inventory levels are radically reduced Production on demand (Just In Time JIT) Management through prevention Continuous improve efficiency productivity Customer order -pull Production Production for inventory(Just In Case- JIC) Quality management inspection and rework Infrequent changes in production practice Quality management through of quality Changes in production practice changes to and Scheduling Forecast –push Production Sales forecast Customer demand Table: 3.1.Lean VS Traditional Manufacturing 4. PROCESS MAPPING Process mapping our value stream is all about detailing the specific actions that are taken throughout our entire process or a specific portion of our processes. There are a number of processes mapping tools that we can use to map business, some of the most useful ones are given below. @ IJTSRD | Available Online @ www.ijtsrd.com | Volume – 2 | Issue – 4 | May-Jun 2018 Page: 109
International Journal of Trend in Scientific Research and Development (IJTSRD) ISSN: 2456-6470 companies want to reduce the amount of time it takes to deliver products to the market. Value Stream Mapping (VSM) Flow Charting Cycle Time: String Diagrams / Spaghetti Diagrams Cycle time is the period required to complete one cycle of an operation or to complete a function, job or task from start to finish. Brown Paper Exercise Why do we need process mapping? Setup Time: Process mapping is one of the top level tools of Lean manufacturing, by this I mean it is a tool that identifies the areas and improvement within the organization by using the other tools of lean manufacturing. By using the various mapping tools that are available we can identify the various process steps that either add value or cost us money within company. A future state map provides us with this clear vision that we need to achieve and provides the team with direction. Fig 4.1 shows value stream cycle. Period required to prepare device, machine, process or system for it to be ready to function or accept a job. steps required for Value added time: Value added time is made up of processes that improve products. This is the amount of time it takes to actually produce the product. Obviously, production time is a value added time because it creates a product from raw materials. Non value added time: Non-value added time is amount of the production cycle time that does not directly produce goods or services. In other words, this is the amount of time that goods are not actively being worked on. 6. DATA INTERPRETED FROM CURRENT VSM From the current value stream map we could see that the total processing time for the product was 14.45 hours and the lead time was 3.2 days. The Lead time of 3.34 days is bit higher and it is due to various wastes. This is due to various delays and errors in different stages. Fig 6.1 shows Value stream map for gas cutting section. Fig 4.1 value stream cycle 5. METRICS USED IN VSM Lead Time: Lead time is the latency between the initiation and execution of a process. Lead time is examined closely in manufacturing and supply chain management as @ IJTSRD | Available Online @ www.ijtsrd.com | Volume – 2 | Issue – 4 | May-Jun 2018 Page: 110
International Journal of Trend in Scientific Research and Development (IJTSRD) ISSN: 2456 in Scientific Research and Development (IJTSRD) ISSN: 2456 in Scientific Research and Development (IJTSRD) ISSN: 2456-6470 Fig 6.1 Value Stream Map Fig 6.1 Value Stream Map – Gas Cutting There are no proper drawings with dimensional specifications for the components to be manufactured by the worker, since they used to work. With manufactured spare as their model. Due to this factor the setup time for dimensions requirement in Lathe and Gas Cutting work consumes more time. Also this leads to over processing in Forging operation of Mirror and Casing manufacturing. This operation of Mirror and Casing manufacturing. This There are no proper drawings with dimensional specifications for the components to be manufactured also shows lack of information flow between worker also shows lack of information flow between worker and engineer. Total lead time in hrs = 22.4hrs Wasted time = 1.5hrs Lead time if dimensions are available = 19.9hrs % of time excess = ((1.5)/22.4) *100 = 6.69% hrs = 22.4hrs With manufactured spare as their model. Due to this dimensions requirement in Lathe and Gas Cutting work consumes more time. Also this leads to over processing in Forging Wasted time = 1.5hrs Lead time if dimensions are available = 19.9hrs = ((1.5)/22.4) *100 = 6.69% @ IJTSRD | Available Online @ www.ijtsrd.com @ IJTSRD | Available Online @ www.ijtsrd.com | Volume – 2 | Issue – 4 | May-Jun Jun 2018 Page: 111
International Journal of Trend in Scientific Research and Development (IJTSRD) ISSN: 2456 in Scientific Research and Development (IJTSRD) ISSN: 2456 in Scientific Research and Development (IJTSRD) ISSN: 2456-6470 Fig 6.2Value stream map for welding section Fig 6.2Value stream map for welding section Accurate process planning is not done before the start of manufacturing, this leads To interruptions in work flow. During the manufacturing of mirror casing and blade plates the flow got interrupted since both the components have to undergo drilling oper same time. Hence the worker waited till alternate worker got succeeded. This leads to wastage of manpower. Also due to interference of work flow the utilization of tools and machines was also delayed due to simultaneous working. Total lead time in hrs = 22.4hrs Wasted time = 0.5hrs Lead time if process plan is available = 21.9hrs % of time excess = ((0.5/22.4) *100 = 2.226% = ((0.5/22.4) *100 = 2.226% Accurate process planning is not done before the start The main problem identified is that since individual components are manufactured completely by an individual workers, the successive operations are carried out by them. This leads to increase in setup time. In the manufacturing of Casing, the worker performed Gas cutting operation, followed by other successive operations required. Whereas the Blade Mounter component also requires Gas Cutting operation but it is carried out by a worker at another period of time. This leads to two different setup From this it is clear that there is no grouping of operations to be carried out in a similar fashion To interruptions in work The main problem identified is that since individual components are manufactured completely by an ual workers, the successive operations are carried out by them. This leads to increase in setup time. In the manufacturing of Casing, the worker performed Gas cutting operation, followed by other successive operations required. Whereas the Blade mponent also requires Gas Cutting operation but it is carried out by a worker at another period of time. This leads to two different setup times. From this it is clear that there is no grouping of operations to be carried out in a similar fashion. flow. During the manufacturing of mirror casing and blade plates the flow got interrupted since both the components have to undergo drilling operation at a same time. Hence the worker waited till alternate worker got succeeded. This leads to wastage of manpower. Also due to interference of work flow the utilization of tools and machines was also delayed due Lead time if process plan is available = 21.9hrs Fig 6.3 Value stream map for casting section Fig 6.3 Value stream map for casting section Total lead time in hrs = 22.4hrs Wasted time = 1.5 hrs be reduced After grouping similar operations 1.5hrs can After grouping similar operations 1.5hrs can @ IJTSRD | Available Online @ www.ijtsrd.com @ IJTSRD | Available Online @ www.ijtsrd.com | Volume – 2 | Issue – 4 | May-Jun Jun 2018 Page: 112
International Journal of Trend in Scientific Research and Development (IJTSRD) ISSN: 2456-6470 Lead time if processes are grouped= 20.9 hrs % of time excess = ((1.5/22.4) *100 = 6.67% Since there is no proper flow, they could not use maximum utilization of manpower and machineries. At a certain period of time both Casing and Blade plate enters the drilling operation, whereas after a certain period of time the machine was in idle condition. During the manufacturing of Casing and Blade both the components were forced to undergo the drilling operation at the same time. This causes Bottlenecks in the manufacturing process. At this Stage the drilling machine was not utilized effectively. In order to overcome this bottlenecks the components have to be prioritized in the way considering the further machining operations to be carried out in the particular component. In this case, the casing should be drilled first because it requires lot more operation to be followed to obtain a complete product. This helps to enable flow. There is no proper stock maintenance in the industry, therefore the shortages of raw materials are identified only during the manufacturing time. Therefore the work could not be continued and got stagnated till the material is purchased. As a result the operation gets prolonged. During the painting process, after the prime coating is painted, there is shortage of paint for sheet metal painting, therefore the operation got stuck till the labor purchased the paint. Total lead time in hrs = 22.4hrs Wasted time = 1hr If stock is maintained to meet requirements, 1hr can be reduced Lead time if processes are grouped = 21.4 hrs % of time excess = ((1)/22.4) *100 = 4.475% Standardized work practices are not followed leading to avoidable wastage of time. The worker was not carrying the required tools for doing the specific operation at the start of manufacturing. Instead he gets to the tool when he finds that the tool was missing. Also after the process gets completed the worker leaves the workspace without arranging the tools in their respective place. This leads to wastage of time for finding the tools when required for alternative process. These errors lead to increased lead time and also delayed product delivery. Also, tradeoffs in design and final product were also made to a small extent. – 4.5 to 5hrs can be reduced – Total lead time – 22.4hrs – Time that can be reduced – 4.5hrs – % of excess time – ((4.5)/22.5)*100= 20% RESULTS AND DISCUSSION: Dimensional specifications for the parts to be manufactured was not clearly provided via drawings. Sample components were referred for dimensions repeatedly and workers communicated several times with each other. Measurements were noted at the beginning as well as during the working. Reworking of components due to less information also happened. This causes slow work flow and several stoppages during the machining of the component paving way for 6.69% of the total lead time. Waste can be avoided by providing engineering drawings of the component to be manufactured with specifications. By implementing this into practice, the non-value added time can be reduced. legible necessary Fig 7.1 Drawing of the Shaft with clear dimensional specifications @ IJTSRD | Available Online @ www.ijtsrd.com | Volume – 2 | Issue – 4 | May-Jun 2018 Page: 113
International Journal of Trend in Scientific Research and Development (IJTSRD) ISSN: 2456 in Scientific Research and Development (IJTSRD) ISSN: 2456 in Scientific Research and Development (IJTSRD) ISSN: 2456-6470 Process planning was not done in the industry. Functioning of the industry in terms of manufacturing components at required pace was not possible. Several stoppages and interferences occurred. Lack of proper direction and coordination among the workers affected was a critical factor affecting the lead time. Resources, manpower were underutilized on a regular basis. Efficiency of output compared to the resources available was less. This lead to 4% wastage of overall lead time. In order to overcome this, process planning was done and a route sheet was obtained before the start of manufacturing. Process plan consists of various information necessary to manufacture a component. It includes various machining operations involved, machines and tools required, manpower, material, time, sequence in which operations to be performed, etc. This helped to create proper information, material flow. Proper allocation of work, effective utilization of manpower, machine resources utilization, less interference among work could be achieved through this. Process planning was not done in the industry. Functioning of the industry in terms of manufacturing d pace was not possible. Several stoppages and interferences occurred. Lack of proper direction and coordination among the workers affected was a critical factor affecting the lead time. manpower were underutilized on a regular basis. Efficiency of output compared to the resources available was less. This lead to 4% wastage of overall lead time. In order to overcome this, process planning was done and a route sheet was obtained before the start of manufacturing. Process plan consists of various information necessary to manufacture a component. It includes various machining operations involved, machines and tools required, manpower, material, time, sequence in which operations to be d, etc. This helped to create proper information, material flow. Proper allocation of work, effective utilization of manpower, machine resources utilization, less interference among work could be Redundancy occurred in the whole process. Components were grouped based on the various common operations they have to undergo. Here we group gas cutting operation to occur at a specified time in a single stage itself. This reduces additional setup time and saves upto 6.67% of the total lead Redundancy occurred in the whole process. Components were grouped based on the common operations they have to undergo. Here we group gas cutting operation to occur at a specified time in a single stage itself. This reduces additional setup time and saves upto 6.67% of the total lead time. There is no proper stock maintenanc therefore the shortages of raw materials are identified only during the manufacturing time. Therefore the work could not be continued and got stagnated till the material is purchased. As a result the operation gets prolonged. This consumed 4.47% of total lead time. Maintaining a checklist to identify the availability of raw materials required to meet the demands was adopted. Practicing this, helps to visualize the requirements prior to the beginning of the manufacturing process. Thereby, sudden interruption during the process. This also helps to avoid the disruption of pull. By adopting this procedure the excess non value added time spent 4.47% can be eliminated. Standardized work practices are not followed leading to avoidable wastage of time. In order to standardize the working process and the environment 5S process was adopted. The importance of practicing 5S was emphasized to the workers. The workers implemented the tool in the shop floor. The tools were kept in proper places. The shop floor was maintained clean. CONCLUSION There is no proper stock maintenance in the industry, therefore the shortages of raw materials are identified only during the manufacturing time. Therefore the work could not be continued and got stagnated till the material is purchased. As a result the operation gets ed 4.47% of total lead time. Maintaining a checklist to identify the availability of raw materials required to meet the demands was adopted. Practicing this, helps to visualize the requirements prior to the beginning of the manufacturing process. Thereby, helping to reduces sudden interruption during the process. This also helps to avoid the disruption of pull. By adopting this procedure the excess non value added time spent Standardized work practices are not followed leading oidable wastage of time. In order to standardize the working process and the environment 5S process was adopted. The importance of practicing 5S was emphasized to the workers. The workers implemented the tool in the shop floor. The tools were kept in oper places. The shop floor was maintained clean. By the implementation of Lean manufacturing at the shop floor, the product lead time was reduced. The comparison of future stream map with Current Stream map shows that the lead the lead time of the product was reduced to 20% than the initial lead time. Therefore our primary objective of the project was achieved. Also the lean manufacturing tools implemented such as 5s, Kaizen Burst will pay way for the Standardized working environment and strives towards the success of the organization effectively. From the project, the manufacturing and lean tools such as 5S was clearly explained to the employees of the industry. The knowledge they gained will help them to strive towards standardized working environment with the elimination of wastes wherever possible. By periodic analysis of the manufacturing process using value stream mapping, the continuous improvement can be afforded.On successive stages of improvement idle state can be achieved in production process. state can be achieved in production process. By the implementation of Lean manufacturing at the shop floor, the product lead time was reduced. The comparison of future stream map with Current Stream map shows that the lead the lead time of the product was reduced to 20% than the initial lead time. erefore our primary objective of the project was achieved. Also the lean manufacturing tools implemented such as 5s, Kaizen Burst will pay way for the Standardized working environment and strives towards the success of the organization effectively. e project, the manufacturing and lean tools such as 5S was clearly explained to the employees of the industry. The knowledge they gained will help them to strive towards standardized working environment with the rever possible. By periodic analysis of the manufacturing process using value stream mapping, the continuous improvement can be afforded.On successive stages of improvement idle Fig 7.2.Drawing of the Casing with specifications Since individual components are manufactured completely by an individual workers, the successive operations are carried out by them. This leads to increase in setup time. In the manufacturing of Casing, the worker performed Gas cutting operation, followed by other successive operations required. Whereas the Blade Mounter component also requires Gas Cutting operation but it is carried out by a worker at another period of time. This leads to two different setup times. From this it is clear that there is no grouping of operations to be carried out in a similar fashion. Grouping of operations based on the processes involved can be done to a certain level. processes involved can be done to a certain level. Fig 7.2.Drawing of the Casing with dimensional Since individual components are manufactured completely by an individual workers, the successive operations are carried out by them. This leads to increase in setup time. In the manufacturing of importance importance of of lean lean cutting operation, followed by other successive operations required. Whereas the Blade Mounter component also requires Gas Cutting operation but it is carried out by a worker at another period of time. This leads to two different is clear that there is no grouping of operations to be carried out in a similar Grouping of operations based on the @ IJTSRD | Available Online @ www.ijtsrd.com @ IJTSRD | Available Online @ www.ijtsrd.com | Volume – 2 | Issue – 4 | May-Jun Jun 2018 Page: 114
International Journal of Trend in Scientific Research and Development (IJTSRD) ISSN: 2456-6470 The project carried out by us will make an impressing mark in the field. By project, we developed our knowledge about Lean Manufacturing Concepts and methods to implement them practically. REFERENCES 1.Value stream mapping to reduce the lead-time of product development process - SatishTyagi, AlokChoudhary, XianmingCai, Kai Yang 2.Applying Value Manufacturing: A Systematic Literature Review - L. F. Romero,A. Arce 3.T.Ohno,Toyota Production Large-Scale Production, Productivity Press, New York, 1988. M. Imai,Gemba Commonsense, Low-Cost Management, McGraw-Hill, New York, 1997. 4.M. Rother, J. Shook, Learning to See: Value Stream Mapping to Add Value and Eliminate Muda, Massachusetts: Lean Enterprise Institute, Massachusetts, 2003. 5.J. P. Womack, D. T. Jones, D. Roos, The Machine that Changed the World: The Story of Lean Production, Macmillan Publishing Company, New York, 1990. 6.J. P. Womack, D. T. Jones, Lean Thinking - Banish Waste and Create Wealth in Your Corporation, Free Press, New York, 2003. 7.S. Borris, Total Productive Maintenance: Proven Strategies and Techniques to Keep Equipment Running at Maximum Efficiency, McGraw-Hill Education, USA, 2006. 8.Seth, D., Gupta, V., 2005. Application of value stream mapping for lean operations and cycle time reduction: an Indian case study. Production Planning & Control. 9.Abdullah, F. (2003). Lean manufacturing tools and techniques in the process industry with a focus on steel (Doctoral dissertation, University of Pittsburgh). 10.Agarda, B., Bassetto, S., 2013. Modular design of product families for quality and cost. Stream Mapping in System: Beyond Kaizen. Approach A to @ IJTSRD | Available Online @ www.ijtsrd.com | Volume – 2 | Issue – 4 | May-Jun 2018 Page: 115