Download
1 / 1
10 likes | 240 Views
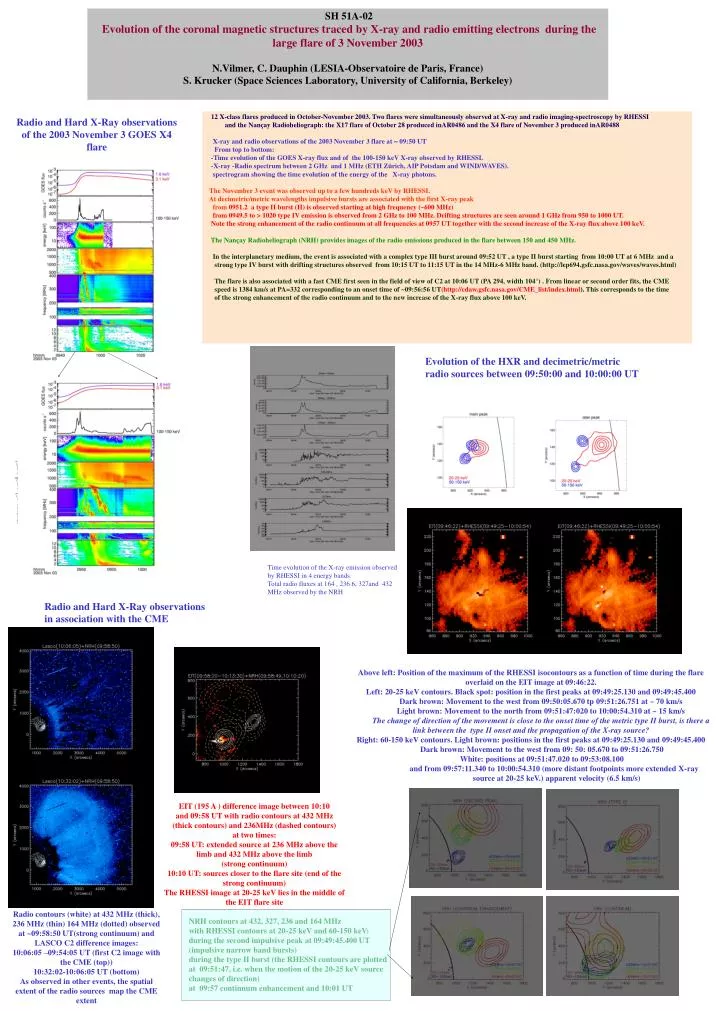
SH 51A-02 Evolution of the coronal magnetic structures traced by X-ray and radio emitting electrons during the large flare of 3 November 2003 N.Vilmer, C. Dauphin (LESIA-Observatoire de Paris, France) S. Krucker (Space Sciences Laboratory, University of California, Berkeley).

E N D
SH 51A-02 Evolution of the coronal magnetic structures traced by X-ray and radio emitting electrons during the large flare of 3 November 2003 N.Vilmer, C. Dauphin (LESIA-Observatoire de Paris, France) S. Krucker (Space Sciences Laboratory, University of California, Berkeley) 12 X-class flares produced in October-November 2003. Two flares were simultaneously observed at X-ray and radio imaging-spectroscopy by RHESSI and the Nançay Radioheliograph: the X17 flare of October 28 produced inAR0486 and the X4 flare of November 3 produced inAR0488 X-ray and radio observations of the 2003 November 3 flare at 09:50 UT From top to bottom: -Time evolution of the GOES X-ray flux and of the 100-150 keV X-ray observed by RHESSI. -X-ray -Radio spectrum between 2 GHz and 1 MHz (ETH Zürich, AIP Potsdam and WIND/WAVES). spectrogram showing the time evolution of the energy of the X-ray photons. The November 3 event was observed up to a few hundreds keV by RHESSI. At decimetric/metric wavelengths impulsive bursts are associated with the first X-ray peak from 0951.2 a type II burst (H) is observed starting at high frequency (~600 MHz) from 0949.5 to > 1020 type IV emission is observed from 2 GHz to 100 MHz. Drifting structures are seen around 1 GHz from 950 to 1000 UT. Note the strong enhancement of the radio continuum at all frequencies at 0957 UT together with the second increase of the X-ray flux above 100 keV. The Nançay Radioheliograph (NRH) provides images of the radio emissions produced in the flare between 150 and 450 MHz. In the interplanetary medium, the event is associated with a complex type III burst around 09:52 UT , a type II burst starting from 10:00 UT at 6 MHz and a strong type IV burst with drifting structures observed from 10:15 UT to 11:15 UT in the 14 MHz-6 MHz band. (http://lep694.gsfc.nasa.gov/waves/waves.html) The flare is also associated with a fast CME first seen in the field of view of C2 at 10:06 UT (PA 294, width 104°) . From linear or second order fits, the CME speed is 1384 km/s at PA=332 corresponding to an onset time of ~09:56:56 UT(http://cdaw.gsfc.nasa.gov/CME_list/index.html). This corresponds to the time of the strong enhancement of the radio continuum and to the new increase of the X-ray flux above 100 keV. Radio and Hard X-Ray observations of the 2003 November 3 GOES X4 flare Evolution of the HXR and decimetric/metric radio sources between 09:50:00 and 10:00:00 UT Time evolution of the X-ray emission observed by RHESSI in 4 energy bands. Total radio fluxes at 164 , 236.6, 327and 432 MHz observed by the NRH Radio and Hard X-Ray observations in association with the CME Above left: Position of the maximum of the RHESSI isocontours as a function of time during the flare overlaid on the EIT image at 09:46:22. Left: 20-25 keV contours. Black spot: position in the first peaks at 09:49:25.130 and 09:49:45.400 Dark brown: Movement to the west from 09:50:05.670 tp 09:51:26.751 at ~ 70 km/s Light brown: Movement to the north from 09:51:47:020 to 10:00:54.310 at ~ 15 km/s The change of direction of the movement is close to the onset time of the metric type II burst, is there a link between the type II onset and the propagation of the X-ray source? Right:60-150 keV contours. Light brown: positions in the first peaks at 09:49:25.130 and 09:49:45.400 Dark brown: Movement to the west from 09: 50: 05.670 to 09:51:26.750 White: positions at 09:51:47.020 to 09:53:08.100 and from 09:57:11.340 to 10:00:54.310 (more distant footpoints more extended X-ray source at 20-25 keV.) apparent velocity (6.5 km/s) EIT (195 A ) difference image between 10:10 and 09:58 UT with radio contours at 432 MHz (thick contours) and 236MHz (dashed contours) at two times: 09:58 UT: extended source at 236 MHz above the limb and 432 MHz above the limb (strong continuum) 10:10 UT: sources closer to the flare site (end of the strong continuum) The RHESSI image at 20-25 keV lies in the middle of the EIT flare site Radio contours (white) at 432 MHz (thick), 236 MHz (thin) 164 MHz (dotted) observed at ~09:58:50 UT(strong continuum) and LASCO C2 difference images: 10:06:05 –09:54:05 UT (first C2 image with the CME (top)) 10:32:02-10:06:05 UT (bottom) As observed in other events, the spatial extent of the radio sources map the CME extent NRH contours at 432, 327, 236 and 164 MHz with RHESSI contours at 20-25 keV and 60-150 keV: during the second impulsive peak at 09:49:45.400 UT (impulsive narrow band bursts) during the type II burst (the RHESSI contours are plotted at 09:51:47, i.e. when the motion of the 20-25 keV source changes of direction) at 09:57 continnum enhancement and 10:01 UT