Download
1 / 35
360 likes | 593 Views
THE CHESAPEAKE BAY TMDL: Restoring Waters of Pennsylvania and the Chesapeake Bay. CBP Citizens’ Advisory Committee July 15, 2010. 1. PA Chesapeake Basin. Over 50 % of the land in PA drains to the Chesapeake Bay

E N D
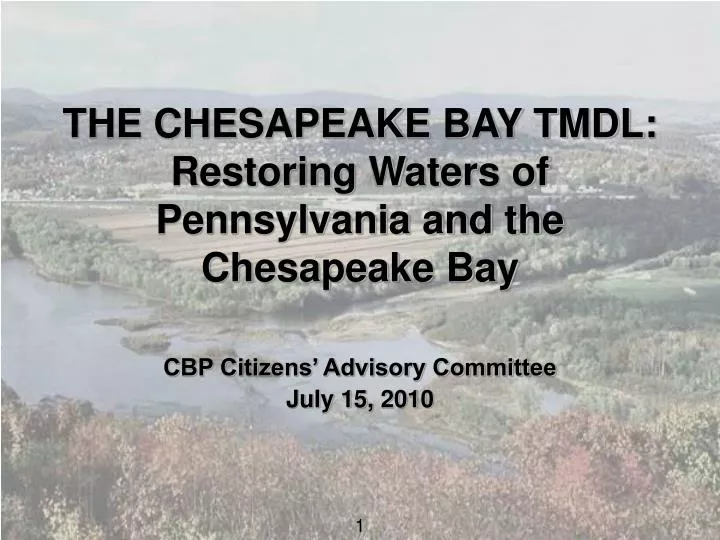
THE CHESAPEAKE BAY TMDL: Restoring Waters of Pennsylvania and the Chesapeake Bay CBP Citizens’ Advisory Committee July 15, 2010 1
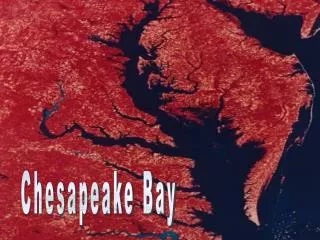
PA Chesapeake Basin Over 50 % of the land in PA drains to the Chesapeake Bay The Susquehanna River is the largest tributary of the Chesapeake Bay, providing 90% of the freshwater flow to the upper bay and ½ the total flow into the Bay PA’s Potomac provides an additional 2% of the Bay’s freshwater flow New York Pennsylvania Maryland Delaware West Virginia District of Columbia Chesapeake Bay Watershed Boundary Virginia
PA’s Chesapeake Basin PA encompasses 35.2% of the Bay watershed -- that’s 14,358,159 acres Four PA watersheds Susquehanna River (13,298,520 acres, 32.6%) Potomac River (1,012,222 acres, 2.5%) Eastern Shore (40,262 acres, 0.1%) Western Shore (7,155 acres, 0.02%) Impaired PA waters due to major sources: Agriculture 3,558 m. Mine drainage 1,952 m. Urban runoff/stormwater 518 m. 3
Nutrient Loads by State Nitrogen* Phosphorus *EPA estimates a nitrogen load of 284 million lbs nitrogen in 2008. EPA assumes a reduction of 7 million lbs due to the Clean Air Act. This leaves 77 millions lbs to be addressed through the TMDL process. 8
Nutrient Sources of Pennsylvania Sources of Phosphorus from PA Sources of Nitrogen from PA N and P values from 2008 Scenario of Phase 5.2 Watershed Model 9
PA’s Past, Present and Future Estimated Loads Nitrogen Phosphorus All scenarios run through Phase 5.2 Watershed Model 10
The Chesapeake Bay TMDL • EPA sets pollution diet to meet states’ Bay clean water standards • Caps on nitrogen, phosphorus and sediment loads for all 6 Bay watershed states and DC • States set load caps for point and non-point sources 11
What are the Draft Allocations for the Bay Watershed? Current model estimates are that the states’ Bay water quality standards can be met at basinwide loading levels of: - 187.4 million pounds nitrogen per year - 12.5 million pounds phosphorus per year (Sediment target cap load under development-will be available by August 15, 2010) 12
State Draft Allocations Nitrogen Phosphorus All loads are in millions of pounds per year. 14
PA loads in the Bay TMDL • For PA (and upland states), only aggregate loads will be in the TMDL for NPS and PS* • Those aggregate loads will be split into the Potomac Drainage and the Susquehanna drainage * Only if the state WIP provides more detail on loadings from individual sources or source sectors
Scale of Bay WIP Target Loads • Bay TMDL: WLAs and LAs for 92 303(d) segments • Bay WIPs: Subdivide by source sector, NPDES, segment drainage, and, by Nov. 2011, local area • Progress first assessed at jurisdiction scale
Watershed Implementation Plans (WIPs) • Stage 1: 60% reductions achieved by 2017 • Stage 2: All controls in place no later than 2025
Bay TMDL Watershed Implementation Plans Will Include 8 Elements: • Interim and Final Target Loads • Current Program Capacity • Mechanisms to Account for Growth • Gap Analysis • Commitment to Fill Gaps: Policies, Rules, Dates for Key Actions • Tracking and Reporting Protocols • Contingencies for Failed, Delayed or Incomplete Implementation • Appendix with: • Loads divided by 303(d) segment drainage and source sector • 2-year milestone loads by jurisdiction – EPA will use to assess milestones • No later than November 2011: Update to include loads divided by local area and controls to meet 2017 interim target load Source: EPA November 2009 Ltr to States available at www.epa.gov/chesapeakebaytmdl
EPA Bay TMDL Process Major basin jurisdiction loading targets Local Program Capacity/Gap Evaluation Final TMDL Established December 2010 Oct 2009 Bay TMDL Public Meetings Phase 2 Watershed Implementation Plans: Jan – Nov 2011 Divide Target Loads among Watersheds, Counties, Sources November-December 2009 Phase 1 Watershed Implementation Plans: Due Sept. 1, 2010 2-year milestones, reporting, modeling, monitoring Starting 2011 Public Review And Comment Sept. 24 – Nov. 8 2010 20
PA Chesapeake Watershed Implementation Plan • PA Chesapeake Watershed Implementation Plan (WIP) Management Team • Point & Nonpoint Source Compliance • Advanced Technologies & Nutrient Trading • Milestone Implementation & Tracking
PA Chesapeake Watershed Implementation Plan (WIP) Management Team • WIP Management Team. Chair: Deputy Secretary John Hines • Meetings: March 31, May 13, June 29 • Wastewater Workgroup. Chair: Pete Slack, PMAA; Co-Chairs: Andy Zemba, Ron Furlan, DEP • Meetings: April 30, July 13 • Urban/Suburban/Rural Workgroup. Chair: Mary Gattis-Schell, Lancaster County Planning Commission; Co-Chair: Ann Roda, DEP • Meetings: May 5, May 27, June 21, July 15 • Two sub-workgroups formed to develop a compliance strategy and an urban nutrient management component • Agriculture Workgroup. Chair, Mike Pechart, PDA; Co-Chair: Frank Schneider, DEP. • Meetings: May 10, June 3, June 21, July 15
PA Point Source Compliance PlanDoes Not Change! December 2006 Point Source Plan Significant Facilities: Cap Load Allocation based on Design Flow at 6 mg/l TN and 0.8 mg/l TP 3-phase 10 year strategy Cap load met in first 5 year phase. 63 plants – 85% Phase 2 (50 plants – 10%) & Phase 3 (70 plants – 5%) to maintain the cap load into the future as systems approach design capacity Non-significant: Cap Load Allocation based on Design Flow at 8 mg/l TN and 1 mg/l TP 0.2 mgd to 0.4 mgd first Plans meet the 5.4 million pound TN and 0.25 million pound TP reduction goal.
PA Point Source Compliance Plan - STATUS • All of the 63 Phase 1 permits are already issued. • 43 will be in compliance by 2011 • 13 will be in compliance by 2012 • 7 will be in compliance by 2015. • The regional offices will be issuing NPDES permits for Phase 2 facilities by the end of this year or early next year. • In March 2010, 92.8a letters will be sent to Phase 3 facilities. • Significant Industrial Facility Plan completed. • 30 significant industrial dischargers: Discharge more than 75 lbs/day of TN and/or 25 lbs/day of TP. • Regional offices will send out 92.8a letters after the 1st of the year. • All industrial dischargers with a potential to discharge nutrients (significant and non-significant) will be required to monitor for nutrients.
New Development • New Point Source • Zero Net Load – Options: • Land Application of Effluent With Crop Uptake • Recycle and Reuse of Effluent • Load Offsets • Purchasing Credits (Trading) • Connection to Existing Point Source • No New Requirements • Point Source Decision Whether It Can Meet Its Cap Loads
Nonpoint Source Compliance • Chesapeake Bay Agriculture Water Quality Initiative • 1) Continue existing Regulatory programs (CAFO inspections and CAO inspections. • 2) Evaluate and Modify Regulatory and Administrative tools (102 revisions, MMM revisions, Federal CAFO program consistency), and • 3) Targeted Watershed Approach to increase agricultural compliance • identify small ag impaired watersheds to conduct farm assessments to determine status of BMP implementation and compliance with regulatory requirements • DEP is involved with an EPA project in Watson Run Lancaster county that is similar to the targeted approach under this initiative. Farms have been assessed and negotiations (between EPA, DEP, and LCCD) are on-going regarding next steps toward compliance.
Nonpoint Source Compliance • Stormwater: • Revising Chapter 102 to incorporate Post Construction Stormwater Management requirements. • Revising PAG-13 which addresses stormwater in MS4 communities by incorporating additional requirements for meeting local TMDLs related to stormwater impairments of local streams.
Advanced Technologies & Nutrient Trading Credits and Contracts: • 91 proposals have been submitted • 86 have been approved • over 3 million nitrogen (N) credits, 280,000 phosphorous (P) credits • 8 contracts completed: • 3 for new development • 2 for existing WWTP facilities
Advanced Technologies & Nutrient Trading Innovative Technologies • Cove Area Regional Digester Project – CARD • Enhanced Digester to process dairy manure in Blair/Bedford • 14 enhanced digesters placed in the top two counties (Lancaster & Franklin) for dairy manure could possibly reduce TN load by about one-third, or 9 million pounds. • 42 digesters in forty counties in PA’s Chesapeake watershed could reduce TN by about 27 million pounds. • These technologies are not inexpensive to develop -- they can require as much as $35 to $40 million in start-up revenue/loans. Nutrient credits, renewable energy credits and selling electricity to the grid are potential funding sources. • Bion Environmental Technologies: process dairy manure in Lancaster • EnergyWorks: process poultry manure in Adams
Bank and Exchange: • The Bank and Exchange will: • Purchase nutrient credits as needed to establish a portfolio of available nutrient reduction credits; and • Sell nutrient reduction credits for a set price and time period. • PENNVEST awarded a contract to Chicago Climate Exchange (CCX) in Jan 2009 to establish the framework for the Bank and Exchange. • The design and function of the Bank and Exchange were discussed at the October PENNVEST Board Meeting. • 1st Auction is anticipated to be held in the Fall of 2010.
Milestone Implementation & Tracking • BMP Tracking Issues: • Collect BMP implementation data from state and federal agencies • Most reported BMPs are associated with a grant program • Chances are, if its not funded with a grant, its not tracked • Exceptions: PA Nutrient Management Plans, NRCS Conservation Tillage Survey
Milestone Implementation & Tracking • BMP Tracking Solutions: • DEP Nonpoint Source BMP Database under development • County Conservation District BMP Tracking Pilot Projects • Lancaster County • Survey 5% of farms for Core Four BMPs • Aerial Survey of Buffers • Bradford County • Agricultural BMPs: • Farm visits – on the job • Targeted Farm visits • Meeting Surveys • Phone Surveys • Aerial Surveys • Streambank Stabilization and Dirt & Gravel Roads
www.dep.state.pa.us • DEP Programs A – Z • C – Chesapeake Bay