Download
1 / 28
280 likes | 288 Views
This empirical analysis examines the impact of indirect network effects on the home video game market, specifically focusing on software variety and hardware sales. The study also explores the barriers to entry and the predictive power of the model used.

E N D
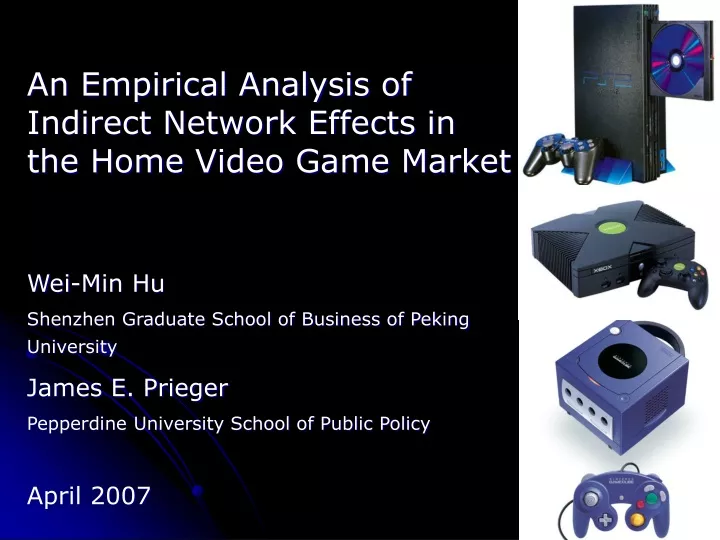
An Empirical Analysis of Indirect Network Effects in the HomeVideo Game Market Wei-Min Hu Shenzhen Graduate School of Business of Peking University James E. Prieger Pepperdine University School of Public Policy April 2007
Indirect Network Effects Software Variety Hardware Sales DVD(CD), MP3, ATM, PDA, Video Games Software Sales and Profit
Why the Video Game Market? • Data are available, have been used in other studies. • Yearly sales in the video game industry are nearly $10 billion ( > Hollywood’s box office) • The average gamer spendsmore than triple the amount of time playing video games each week than time spent in • exercise, • reading, • community, religious, and creative activities… • combined!
Our Study Examines • Relative impact of console price and game variety on market share • Is there an applications barrier to entry? • How well our model predicts out-of-sample. Are these structural models generalizable? • Both are important, but the variety effect has become less important relative to the price effect • There is little evidence for an applications • barrier to entry • Predicts Japanese video market well, does not • match other predictions for U.S. market
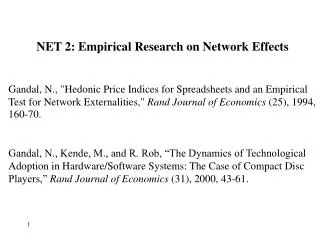
Literature Review • Theoretical Chou and Shy (1990) Church and Gandal (1992; 1994) Nair et.al. (2004) • Empirical Gandal, Kende, and Rob (2000) –Compact Disc Player Dranove and Gandal (2003)—DVD and Divx Nair, et. al. (2004)—Personal Digital Assistants Clements and Ohashi (2005)—Video Games
Evolution of Video Game Consoles 1st Generation (late 1970s) ATARI 2600 ATARI PONG
Home Video Games 2nd Generation (early 1980s) COLECO MATTEL INTELLIVISION ATARI 5200
Home Video Games 3rd Generation (mid-late 1980s) ATARI 7080 SEGA MASTER NES
Home Video Games 4th Generation (early 1990s) SEGA GENESIS PHILIPS CDI SNES
Home Video Games 5th Generation (1995-2000) ATARI JAGUAR PlayStation I N64 SEGA SATURN
Home Video Games 6th Generation (2000-2005) PlayStation2 GameCube XBOX Dreamcast
The Market for 6th Generation Home Video Games • Sony’s PS2 is the market leader, both in console sales and in game titles • Was introduced a year earlier than XBOX and GameCube • Has slower processor, less RAM • PS2 and XBOX sell for about same price • GameCube is cheaper, has smallest mkt share • PS2 has largest proportion of exclusive game titles
Empirical Model • Based on the static structural model of Nair et al. (2004) • Hardware adoption (demand) • Software supply
Empirical Model • Hardware demand: Logit discrete choice cj : console dummies and year dummies dt : holiday dummies Why not use nested logit? Do not have good instruments for within group share
Empirical Model • Software Supply
Endogeneity and Instruments • Endogeneity in hardware adoption: • Pjt : a shock to brand image (in xjt ) will also affect prices • Njt : a shock to xjt-1 + autocorrelation in the HW supply equation + indirect network effects in SW supply equation => Njt correlated with xjt • Instruments: Pjt: Japanese retail console price (Nikkei News) and current Japanese–US exchange rates Njt: Japanese game variety (Famitsu) Console age, age2 • Will carefully check strength and validity of instruments
Data Potential market size: households with at least one television StatisticalAbstract of the United States (Census Bureau, 2004-2005) Console sales (monthly, Mar 2002-Dec 2004): NPD fun group Price (adjusted by CPI): 7 major retail chains Game titles: Gamespot.com
Results: Console Demand Hausman test rejects the OLS in favor of the IV
Strategic Tradeoffs Between Lowering Price and Enhancing Game Supply -es/ep: %DP that increases demand as much as a 1% increase in game variety Average = 0.39, but decreasing over time
Is There An Applications Barrier to Entry? • Barriers to entry based on software applications for a system received much discussion in Microsoft antitrust case • Antitrust Concern: Can a console maker hinder entry by competing systems through exclusive games.
Do the Network Effects Differ for Exclusive Games? • Predatory conduct of the console maker would be more effective if unique games have strong indirect network • Re-estimate the console demand model by splitting unique and non-unique games • Results: • Little network effect for unique games… • …it all comes from the nonunique games.
Counterfactuals to Assess Applications Barriers to Entry • Another way to assess the feasibility of using unique games as a strategic weapon: counterfactual scenarios • no firm has the ability to create unique games • only the non-dominant firms have the ability to create unique games • Outlawing exclusively provided games does not change PS2’s dominant status in console market share
Is There An Applications Barrier to Entry? Summary • Unique games appear to be less effective than non-unique games in changing console demand • Even outlawing exclusively provided games does not change PS2’s dominant status in console market share • There may not be much reason for concern regarding applications barriers to entry in video game market
Out-of-Sample Prediction • Compare our estimation result to that of Clements and Ohashi (2005) • 2002 is at the end of their sample, and the beginning of ours:
Turn our data around and estimate a Japanese console demand equation Price and software elasticities are about the same So: model generalizes horizontally but not over time? Out-of Sample Prediction: Compare US Data to Japan Data
Conclusion • Indirect network effects are present on both sides of the market • We find little evidence of applications barriers to entry through creating exclusively provided games • We find little generalizability of our results to previous markets • Flip side: previous studies do not extrapolate well to 6th generation • Policy makers cannot escape doing the case study anew?