Download
1 / 6
60 likes | 295 Views
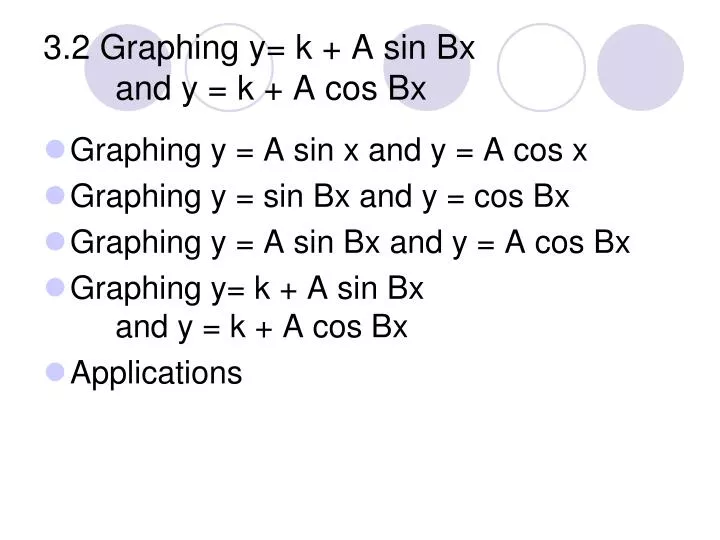
3.2 Graphing y= k + A sin Bx and y = k + A cos Bx. Graphing y = A sin x and y = A cos x Graphing y = sin Bx and y = cos Bx Graphing y = A sin Bx and y = A cos Bx Graphing y= k + A sin Bx and y = k + A cos Bx Applications. Comparing Amplitudes. Compare the graphs of y = 1/3 sin x

E N D
3.2 Graphing y= k + A sin Bx and y = k + A cos Bx • Graphing y = A sin x and y = A cos x • Graphing y = sin Bx and y = cos Bx • Graphing y = A sin Bx and y = A cos Bx • Graphing y= k + A sin Bx and y = k + A cos Bx • Applications
Comparing Amplitudes • Compare the graphs of y = 1/3 sin x and y = 3 sin x • The effect of A in y = A sin x is to increase or decrease the y values without affecting the x values.
Comparing Periods • Compare the graphs of y = sin 2x and y = sin ½ x The graph shows the change in the period.
Amplitude and Period For both y = A sin Bx and y = A cos Bx: Amplitude = |A| Period = 2p/B
Vertical Shift • y = -2 + 3 cos 2x, -p x 2p • Find the period, amplitude, and phase shift and then graph
Period and Frequency • For any periodic phenomenon, if P is the period and f is the frequency, P = 1/f.