Download
1 / 27
270 likes | 402 Views
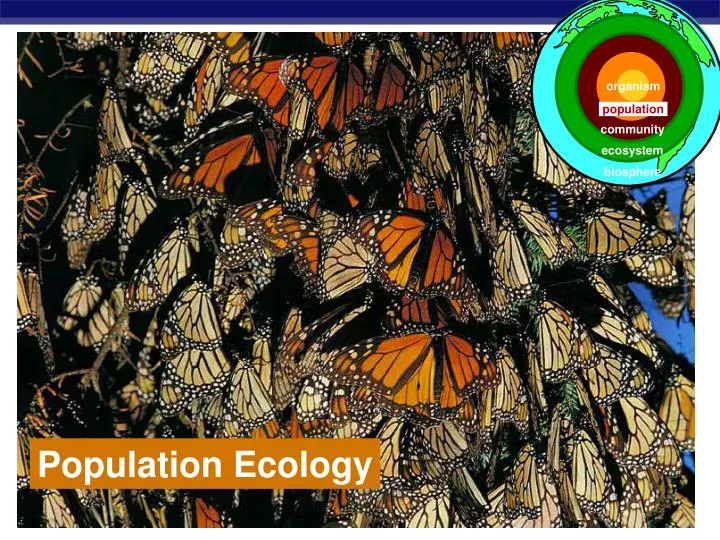
organism. population. community. ecosystem. biosphere. Population Ecology. April 26, 2012. BellRinger Quiz List at least 3 factors that can affect the size of a population Objective Use an interactive model to describe how resource availability can affect population size Homework

E N D
organism population community ecosystem biosphere Population Ecology
April 26, 2012 • BellRinger Quiz • List at least 3 factors that can affect the size of a population • Objective • Use an interactive model to describe how resource availability can affect population size • Homework • Complete analysis questions and deer handout • Chp 54 notes due tomorrow
Life takes place in populations • Population • group of individuals of same species in same area at same time • rely on same resources • interact • interbreed Population Ecology: What factors affect a population?
Factors that affect Population Size • Abiotic factors • sunlight & temperature • precipitation / water • soil / nutrients • Biotic factors • other living organisms • prey (food) • competitors • predators, parasites, disease • Intrinsic factors • adaptations
1970 1966 1960 1964 1965 1943 1951 1961 Equator 1958 1937 1956 Immigration from Africa ~1900 1970 Characterizing a Population • Describing a population • population range • pattern of spacing • density • size of population range density
Population Range • Geographical limitations • abiotic & biotic factors • temperature, rainfall, food, predators, etc. • habitat adaptations topolar biome adaptations torainforest biome
April 27, 2012 • BellRinger • Extend your graph from yesterday, make a prediction how the population would grow under ideal circumstances • Objective • describe how resource availability can affect population size • Homework • Chp 55 notes (sec 1-3)
Population Size • Changes to population size • adding & removing individuals from a population • birth • death • immigration • emigration
Population growth change in population = births – deaths Exponential model (ideal conditions) dN = riN dt growth increasing at constant rate N = # of individuals r = rate of growth ri = intrinsic rate t = time d = rate of change every pair has 4 offspring every pair has 3 offspring intrinsic rate= maximum rate of growth
Exponential growth rate • Characteristic of populations without limiting factors • introduced to a new environment or rebounding from a catastrophe Whooping crane coming back from near extinction African elephant protected from hunting
Logistic rate of growth • Can populations continue to grow exponentially? Of course not! no natural controls K =carryingcapacity effect of natural controls What happens as N approaches K?
10 8 Number of breeding male fur seals (thousands) 6 4 2 0 1915 1925 1935 1945 Time (years) 500 400 Number of cladocerans (per 200 ml) 300 200 100 0 0 10 20 30 40 50 60 Time (days) Carrying capacity • Maximum population size that environment can support with no degradation of habitat • varies with changes in resources What’s going on with the plankton?
Changes in Carrying Capacity • Population cycles • predator – prey interactions At what population level is thecarrying capacity? K K
Regulation of population size marking territory= competition • Limiting factors • density dependent • competition: food, mates, nesting sites • predators, parasites, pathogens • density independent • abiotic factors • sunlight (energy) • temperature • rainfall swarming locusts competition for nesting sites
Population growth rates • Factors affecting population growth rate • sex ratio • how many females vs. males? • generation time • at what age do females reproduce? • age structure • how females at reproductive age in cohort?
Sex Ratio • Graphic representation of life table The relatively straight lines of the plots indicate relatively constant rates of death; however, males have a lower survival rate overall than females. Belding ground squirrel
1000 Human (type I) Hydra (type II) 100 Survival per thousand Oyster (type III) 10 1 0 25 50 75 100 Percent of maximum life span Survivorship curves What do these graphs tell about survival & strategy of a species? • Generalized strategies I. High death rate in post-reproductive years II. Constant mortality rate throughout life span III. Very high early mortality but the few survivors then live long (stay reproductive)
Age structure • Relative number of individuals of each age What do these data imply about population growth in these countries?
Trade-offs: survival vs. reproduction • The cost of reproduction • increase reproduction may decrease survival • age at first reproduction • investment per offspring • number of reproductive cycles per lifetime Natural selection favors a life history that maximizes lifetime reproductive success
Natural selection for Reproductive strategies • K-selected • Favorable when pops at high density, close to carrying capacity • late reproduction • few offspring • invest a lot in raising offspring • primates • coconut • r-selected • Favorable when pop density is low • early reproduction • many offspring • little parental care • insects • many plants K-selected r-selected
Learning Check • How does k-selected and r-selected reproductive strategies relate to the survivorship curves?
1000 Human (type I) Hydra (type II) 100 Survival per thousand Oyster (type III) 10 1 0 25 50 75 100 Percent of maximum life span Life strategies & survivorship curves K-selection r-selection
Population of… China: 1.3 billion India: 1.1 billion Significant advances in medicine through science and technology Industrial Revolution Human population growth adding 82 million/year ~ 200,000 per day! What factors have contributed to this exponential growth pattern? 20056 billion Is the human population reachingcarrying capacity? Bubonic plague "Black Death" 1650500 million
USA 30.2 Germany 15.6 Brazil 6.4 Indonesia 3.7 Nigeria 3.2 India 2.6 0 2 4 6 8 10 12 14 16 18 20 22 24 26 28 30 32 34 Acres Amount of land required to support an individual at standard of living of population Ecological Footprint over-population or over-consumption? uneven distribution: wealthiest 20% of world: 86% consumption of resources 53% of CO2 emissions
Ecological Footprint deficit surplus Based on land & water area used to produce allresourceseach country consumes & to absorb allwastesit generates