Download
1 / 15
150 likes | 265 Views
Preliminary Comparisons of CMAQ and in-situ O 3 , NO 2 , and HCHO observations during DISCOVER-AQ. Melanie Follette-Cook Ken Pickering, Pius Lee, Ron Cohen, Alan Fried, Andrew Weinheimer, Jim Crawford, Yunhee Kim, Rick Saylor IWAQFR November 30, 2011. DISCOVER-AQ: Investigation Overview.

E N D
Preliminary Comparisons of CMAQ and in-situ O3, NO2, and HCHO observations during DISCOVER-AQ Melanie Follette-Cook Ken Pickering, Pius Lee, Ron Cohen, Alan Fried, Andrew Weinheimer, Jim Crawford, Yunhee Kim, Rick Saylor IWAQFR November 30, 2011
DISCOVER-AQ:Investigation Overview Deriving Information on Surface Conditions from COlumn and VERtically Resolved Observations Relevant to Air Quality Objectives: • Relate column observations to surface conditions for aerosols and key trace gasesO3, NO2, and HCHO • Characterize differences in diurnal variation of surface and column observations for key trace gases and aerosols • Examine horizontal scales of variability affecting satellites and model calculations Deployments: Maryland – July 2011 California – January 2013? Texas – September 2013 TBD – Summer 2014 IWAQFR November 30, 2011
DISCOVER-AQ Deployment Strategy Systematic and concurrent observation of column-integrated, surface, and vertically-resolved distributions of aerosols and trace gases relevant to air quality as they evolve throughout the day. • Continuous lidar mapping of aerosols with HSRL on board B-200 • Continuous mapping of trace gas columns with ACAM on board B-200 • In situ profiling over surface measurement sites with P-3B • Continuous monitoring of trace gases and aerosols at surface sites to include both in situ and column-integrated quantities • Surface lidar and balloon soundings IWAQFR November 30, 2011
DISCOVER-AQ:Investigation Overview Sample Flight Path of P3 and spiral locations Fair Hill Padonia Aldino Edgewood Essex Chesapeake Bay Beltsville IWAQFR November 30, 2011
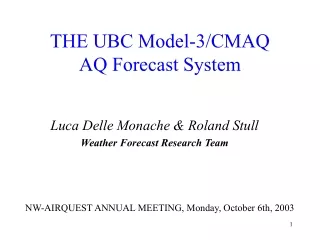
Experimental NOAA CMAQ forecast CMAQ v. 4.6 Driven by WRF-NMM meteorology 48 hour forecasts issued each day at 12Z during the campaign Therefore, for each flight there are two relevant forecasts ‘0 hr’ – the forecast that was issued the day of the flight ‘24 hr’ – the forecast that was issued the day before the flight IWAQFR November 30, 2011
Forecast evaluation:0 hr vs. 24 hr • *** All DISCOVER-AQ results are preliminary field data *** • The flight data analyzed are 60 sec averages (rather than the native 1 sec resolution) for a more appropriate comparison to the 12 km CMAQ output • The observations have been collocated in space and time with the CMAQ output • Percent error = • (model – observation )/ observation * 100 • For all flight days during the campaign it was noted which forecast had lower absolute values of percent error • These results are summarized in the following histogram plots IWAQFR November 30, 2011
Forecast evaluation: 0 hr vs. 24 hr Histograms O3 NO2 (NCAR) • With respect to the O3 observations, the forecasts perform equally in terms of percent error • The 0 hr forecast performed better than the 24 hr when compared with the HCHO and NCAR NO2 observations • The following comparisons will therefore show the 0 hr forecast results HCHO IWAQFR November 30, 2011
Forecast evaluation:Model Biases in the PBL and FT • Aircraft observations overplotted onto CMAQ output curtain plots • Scatterplots of observations vs CMAQ IWAQFR November 30, 2011
Flight #9 Thursday 7-21-2011 CMAQ NO2 Curtain with NCAR NO2 • R=0.84 CMAQ NO2 Curtain with Berkeley NO2 • R=0.83 CMAQ reproduces variability seen in the observations in both the PBL and FT IWAQFR November 30, 2011 * Berkeley NO2 has less coverage than NCAR NO2 due to cycling through N species
CMAQ NO2 vs. NCAR NO2 07/10/2011 07/14/2011 < 2.5 km > 2.5 km 07/27/2011 07/28/2011 CMAQ agrees relatively well with both NO2 datasets IWAQFR November 30, 2011
CMAQ O3 Curtain with NCAR O3Flight #12 Wednesday 7-27-2011 CMAQ underestimates ozone above the boundary layer CMAQ overestimates ozone in the boundary layer IWAQFR November 30, 2011
CMAQ O3 vs. NCAR O3 < 2.5 km > 2.5 km CMAQ overestimates O3 in the PBL on nine out of the 14 flight days CMAQ underestimates O3 in the free troposphere on six out of the 14 flight days Sat 7/2 Fri 7/1 Tue 7/5 Sun 7/10 Thu 7/14 Wed 7/20 Mon 7/11 Sat 7/16 Thu 7/21 Tue 7/26 Thu 7/28 Fri 7/22 Wed 7/27 Fri 7/29
CMAQ HCHO Curtain with HCHO measurementsFlight #9 Thursday 7-21-2011 CMAQ underestimates HCHO in the boundary layer IWAQFR November 30, 2011
Sat 7/2 Fri 7/1 Sun 7/10 CMAQ HCHO vs. HCHO measurements < 2.5 km > 2.5 km Thu 7/14 Wed 7/20 Mon 7/11 Sat 7/16 Thu 7/21 CMAQ underestimates large boundary layer HCHO mixing ratios on ten out of 13 flight days Tue 7/26 Thu 7/28 Fri 7/22 Wed 7/27 Fri 7/29
Summary • Observations taken during DISCOVER-AQ were averaged to a temporal resolution of 60 sec to compare with two CMAQ forecasts • When compared with HCHO and the NCAR NO2 observations, the 0 hr forecast displayed lower absolute values of percent error • The 0 hr and 24 hr forecasts performed equally with respect to the O3 observations • CMAQ reproduced the variability seen in the NO2 observations, and no bias was observed • CMAQ underestimated O3 above 2.5 km on six out of the 14 flight days, and overestimated O3 below 2.5 km on nine out of 14 flight days • CMAQ underestimated HCHO below 2.5 km on ten out of 13 flight days IWAQFR November 30, 2011