Download
1 / 29
300 likes | 307 Views
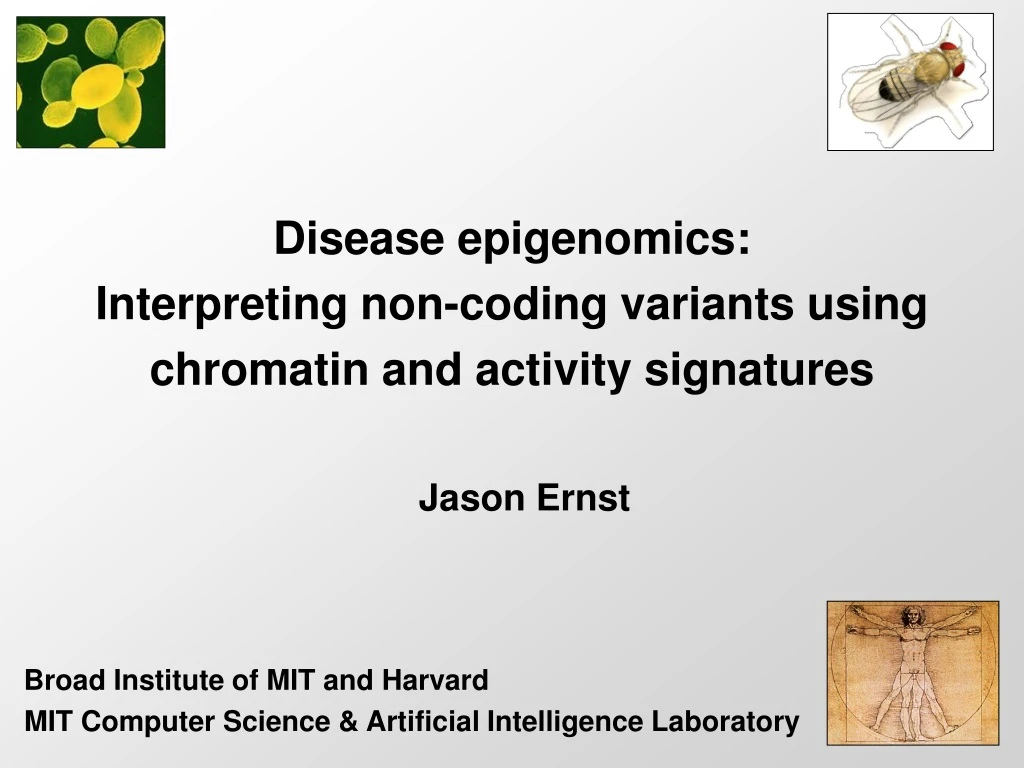
Disease epigenomics: Interpreting non-coding variants using chromatin and activity signatures. Jason Ernst. Broad Institute of MIT and Harvard. MIT Computer Science & Artificial Intelligence Laboratory. Challenge: interpreting disease-associated variants. Gene annotation

E N D
Disease epigenomics: Interpreting non-coding variants usingchromatin and activity signatures Jason Ernst Broad Institute of MIT and Harvard MIT Computer Science & Artificial Intelligence Laboratory
Challenge: interpreting disease-associated variants • Gene annotation • (Coding, 5’/3’UTR, RNAs) • Evolutionary signatures • GWAS, case-control,… reveal disease-associated variants Molecular mechanism, cell-type specificity, drug targets • Challenges towards interpreting disease variants • Find ‘true’ causative SNP among many candidates in LD • Use ‘causal’ variant: predict function, pathway, drug targets • Non-coding variant: type of function, cell type of activity • Regulatory variant: upstream regulators, downstream targets • This talk: genomics tools for addressing these challenges Roles in gene/chromatin regulation Activator/repressor signatures CATGACTG CATGCCTG Disease-associated variant (SNP/CNV/…) Non-coding annotation Chromatin signatures Other evidence of function Signatures of selection (sp/pop)
The good news: ever-expanding dimensions Additional dimensions: Environment Genotype Disease Gender Stage Age Each point represents a genome-wide dataset • Now: Cell-type and chromatin-mark dimensions • Next: References for each background • All clearly needed, and increasingly available Chromatin marks Cell types
Difficulty of interpreting increasing # tracks Challenge: simplify • Learn combinations • Interpret function • Prioritize marks • Study dynamics
Challenge of data integration in many marks/cells • Epigenetic modifications • DNA/histone/nucleosome • Encode epigenetic state • Histone code hypothesis • Distinct function for distinct combinations of marks? • Hundreds of histone marks • Astronomical number of histone mark combinations • How do we find biologically relevant ones? • Unsupervised approach • Probabilistic model • Explicit combinatorics Epigenomic informationretains genome ‘state’in differentiationand development Genome-wide modification maps Hundreds of histone tailmodificationsalready known Two types: DNA methyl. Histone marks DNA packaged intochromatin aroundhistone proteins
Genomic tools for disease SNP interpretation • Chromatin states regulatory region annotation • Combinatorial patterns of marks chromatin states • Distinct classes of prom/enh/transcr/repres’d/repetitive • Reveal new genes, lincRNAs, enhancers, GWAS/SNP • Activity signatures linking enhancer networks • Correlated changes in expression, chromatin, motifs • Link TFs to enhancers and enhancers to targets • Predict causal cell-type specific activators/repressors • Interpreting disease variants • Predicting SNP chromatin states and cell-type specificity • Specific mechanistic predictions for disease SNPs • Measuring selective pressures within human populations
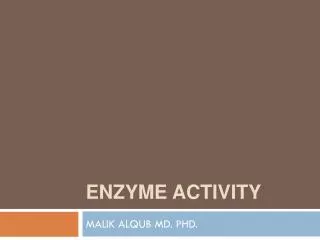
ChromHMM: learning ‘hidden’ chromatin states Transcription Start Site Enhancer DNA Transcribed Region Observed chromatin marks. Called based on a poisson distribution K4me3 K4me3 K4me1 K4me1 K36me3 K36me3 K36me3 K36me3 K27ac K4me1 Most likely Hidden State 5 2 1 3 5 5 6 6 6 6 4 6 High Probability Chromatin Marks in State 0.8 0.8 1: 0.7 200bp intervals 4: All probabilities are learned de novo from chromatin data alone (Baum-Welch aka. EM) K27ac K4me1 K4me1 0.9 0.8 2: 5: K4me1 K4me3 Each state: vector of emissions, vector of transitions 3: 6: 0.9 0.9 K4me3 K36me3 Ernst and Kellis, Nature Biotech 2010
Chromatin states for genome annotation Promoter states • Learn de novo significant combinations of chromatin marks • Reveal functional elements, even without looking at sequence • Use for genome annotation • Use for studying regulation dynamics in different cell types Transcribed states Active Intergenic Repressed
Emerging large-scale genomic/epigenomic datasets Multiple cell types Diverse experiments Developmental time-course Reference Epigenome Mapping Centers Used to study many disease epigenomes ENCODE Chromatin Group (PI: Bernstein) 15-state model learned jointly 9 chromatin marks+WCE 9 human cell types Promoter Enhancer x Insulator Transcribed Repressed Repetitive HUVEC NHEK H1 … • Cell type concatenation approach • Ensures common emission parameters • Verified with independent learning
Chromatin states capture coordinated mark changes • State definitions are cell-type invariant • Same combinations consistently found • State locations are cell-type specific • Can study pair-wise or multi-way changes
Chromatin states correlation with gene expression -50kb +50kb TSS Higher expression Lower expression
Pair-wise changes reveal cell-type specific functions • Gene functional enrichments match cell function • Distinguish On, Off, and Poised promoter states
Genomic tools for disease SNP interpretation • Chromatin states regulatory region annotation • Combinatorial patterns of marks chromatin states • Distinct classes of prom/enh/transcr/repres’d/repetitive • Reveal new genes, lincRNAs, enhancers, GWAS/SNP • Activity signatures linking enhancer networks • Correlated changes in expression, chromatin, motifs • Link TFs to enhancers and enhancers to targets • Predict causal cell-type specific activators/repressors • Interpreting disease variants • Predicting SNP chromatin states and cell-type specificity • Specific mechanistic predictions for disease SNPs • Measuring selective pressures within human populations
Introducing multi-cell activity profiles Gene expression Chromatin States Active TF motif enrichment TF regulator expression Dip-aligned motif biases TF On TF Off Motif aligned Flat profile Motif enrichment Motif depletion ON OFF Active enhancer Repressed
Promoters typically active in many cells Enhancers exquisitelycell-type specific Enhancer vs. promoter dynamics
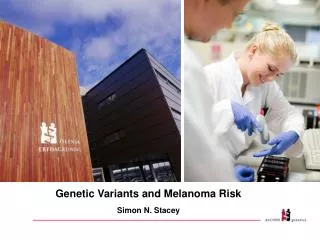
Linking candidate enhancers to correlated target genes CandidateTM4SF1Enhancer Search for coherent changes between: • gene expression • chromatin marks at distant loci (10kb) Combine two vectors: • Expression vector for each gene • Vector of mark intensities at dist locus (combine marks based on enhancer emissions) 3. High correlation enhancer/target link 10kb
Predictive power of distal enhancer regions • At least 100 regions with >80% correlation 10kb upstream Mark intensity correlation w/ expr 100kb upstream 10kb/100kb controls Correlation of individual regions (Sorted by Rank)
Coordinated activity reveals enhancer links Predicted regulators Enhanceractivity Geneactivity • Distal enhancer hard to integrate in regulatory models • Linked to target genes based on coordinated activity • Linked to upstream regulators using TF expr & motifs Activity signatures for each TF
Nucleosome Positioning Footprints Supports Transcription Factor Cell Type Predictions Tag Enrichment for H3K27ac
Genomic tools for disease SNP interpretation • Chromatin states regulatory region annotation • Combinatorial patterns of marks chromatin states • Distinct classes of prom/enh/transcr/repres’d/repetitive • Reveal new genes, lincRNAs, enhancers, GWAS/SNP • Activity signatures linking enhancer networks • Correlated changes in expression, chromatin, motifs • Link TFs to enhancers and enhancers to targets • Predict causal cell-type specific activators/repressors • Interpreting disease variants • Predicting SNP chromatin states and cell-type specificity • Specific mechanistic predictions for disease SNPs • Measuring selective pressures within human populations
xx Enhancer annotation revisits disease SNPs Previously unlinked phenotypes enriched for cell-type specific enhancers
Application1: Pinpoint disease SNPs in enhancers • Much smaller fraction of genome considered • Strong enhancers 1.9%, weak 2.8%, promoter 1.4%
Application 2: Make much more precise predictions Use: * Cell-type specificity of chromatin states * Predicted activators/repressors of these states * Predicted motif instances across the genome
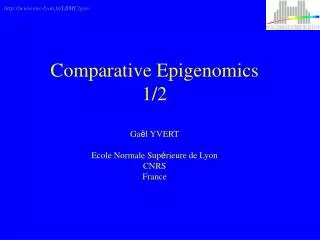
Ex1: Systemic lupus erythematosus intergenic SNP • SNP in lymphoblastoid GM-specific enhancer state • Disrupts Ets1 motif instance, predicted GM regulator Model: Disease SNP abolishes GM-specific enhancer
Ets-1 is a predicted activator of GM/HUVEC enhancers Predicted regulators Enhanceractivity Geneactivity • Enhancer class specific to GM and HUVEC cell types • Ets expression Ets-1 motif enrichment in enhancers Model: Ets-1 disruption would abolish enhancer state Activity signatures for each TF
Ex2: Erythrocyte phenotype study intronic SNP K562: erythroleukaemia cell type • Disease SNP creates motif instance for Gfi-1 repressor • Gfi-1 predicted repressor for K562-specific enhancers Creation of repressive motif abolishes K562 enhancer ` `
Gfi-1 is a predicted repressor of non-K562 enhancers Predicted regulators Enhanceractivity Geneactivity • Gfi expression Gfi-1 motif depletion in enhancers • Prediction: Gfi-1 large-scale repression of non-K562 Motif created Gfi-1 recruited enhancer repressed Activity signatures for each TF
More generally: eQTLs in specific chromatin states • Nucleotide-resolution genome-wide expr. predictors • Strong enrichment for promoter and enhancer states • Trans-eQTLs select for cell-type specific enhancers Dixon 2007: All eQTLs, Lymphoblasts, 400 ind. Schadt 2008: Trans eQTLs, liver cells, 427 ind.
Genomic tools for disease SNP interpretation • Chromatin states regulatory region annotation • Combinatorial patterns of marks chromatin states • Distinct classes of prom/enh/transcr/repres’d/repetitive • Reveal new genes, lincRNAs, enhancers, GWAS/SNP • Activity signatures linking enhancer networks • Correlated changes in expression, chromatin, motifs • Link TFs to enhancers and enhancers to targets • Predict causal cell-type specific activators/repressors • Interpreting disease variants • Predicting SNP chromatin states and cell-type specificity • Specific mechanistic predictions for disease SNPs • Measuring selective pressures within human populations