Download

1 / 13
180 likes | 410 Views
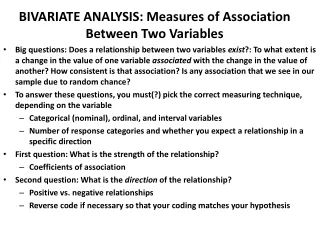
Bivariate Association. Introduction. This chapter is about measures of association These are designed to quantify the strength (or importance) of a relationship They can increase understanding of the causal relationships among variables

E N D
Introduction • This chapter is about measures of association • These are designed to quantify the strength (or importance) of a relationship • They can increase understanding of the causal relationships among variables • Can improve our ability to predict from one variable to another
Association Between Variables and the Bivariate Table • If the distribution of the scores of one variable changes across the categories of another variable, the variables are associated to some extent • The independent variable is in the columns (on top of the table) • In a bivariate table, the categories of the dependent variable are placed in the rows
Association, cont. • If you read the table from column to column, you can observe the effects of the independent variable on the dependent variable (provided that the table is constructed with the independent variable in the columns) • These “within-column” frequency distributions are called the conditional distribution of Y • Since they display the distribution of scores on the dependent variable for each condition (or score) of the independent variable
Chi Square • Another way to find the existence of an association between two variables organized into table format is the chi square statistic • This is a test of significance, but can also be used as an indicator of association • Any nonzero value for the obtained chi square statistic indicates the existence of an association • At least in the sample • But, a large chi square will not indicate a strong relationship, since all significance tests are affected by sample size
Does an association exist? • Because the column totals are not equal, you will need to calculate percentages for each cell in the table • The association between two variables can be seen when the variables are arranged in a bivariate table and percentages are computed in the direction of the independent variable • So, you percentage down, and read across • You divide the number in each cell by the total at the bottom of the column only (not the total of the sample) • If two variables are not associated, then the conditional distributions of Y will not change across the columns
How strong is the association? • At one extreme is the case of no association • At the other is the case of “perfect association” • The strongest possible relationship between X and Y • A perfect association exists between two variables if each value of Y is associated with one and only one value of X • In a bivariate table, all cases in each column would be located in a single cell • There would be no variation in Y for a given value of X (the independent variable)
Strength of Association, cont. • A perfect relationship would be taken as strong evidence of a causal relationship between the variables, for the sample • In the case of a perfect association, predictions from one variable to another can be made without error. However, most associations are much less extreme, since humans are not that predictable • For intermediate relationships that show a tendency for two variables to be associated, measures of association quantify the association by showing how close it is to a perfect association or to no association
Results Indicating Strength • Most all of the statistics are designed so that they have a lower limit of 0 and an upper limit of 1 (plus or minus 1 for ordinal and interval ratio measures of association) • A measure that equals 0 indicates no association between the variables • If the conditional distributions of Y do not change across the categories of X, any measure of association would have a value of 0.00 • And the closer the value of a measure of association is to 1, the stronger the relationship • For ordinal and interval-ratio measures, would be a plus or minus one
Strength and Direction • -1 Perfect negative association • -.9, -.8, -.7 Strong negative association • -.6, -.5, -.4 Moderate negative association • -.3, -.2- -.1 Weak negative association • 0 No association between variables • .1, .2, .3 Weak positive association • .4, .5, .6 Moderate positive association • .7, .8, .9 Strong positive association • + 1 Perfect positive association
What is the pattern or direction of the association? • When both variables are at least ordinal in level of measurement, the pattern of association may also have a direction to it • No direction for nominal variables, because categories are all the same • If there is a positive association between two variables, as one variable increases in value, the other also increases • High scores on one variable are associated with high scores on the other variable, and low scores on one variable are associated with low scores on the other
Interpretation, cont. • The measures of association find if the variables are related by looking at each individual in the sample • We have to look at one person’s answer to one question, and their answer to the other question • Then, we put it together with all the other people to see if there is a pattern • When variables vary in opposite directions, the association between variables is negative • Measures of association are designed so they will be positive for positive associations and negative values for negative associations • So, we need to look at the existence, the strength, and the direction of the association to complete the analysis