Download
1 / 36
360 likes | 677 Views
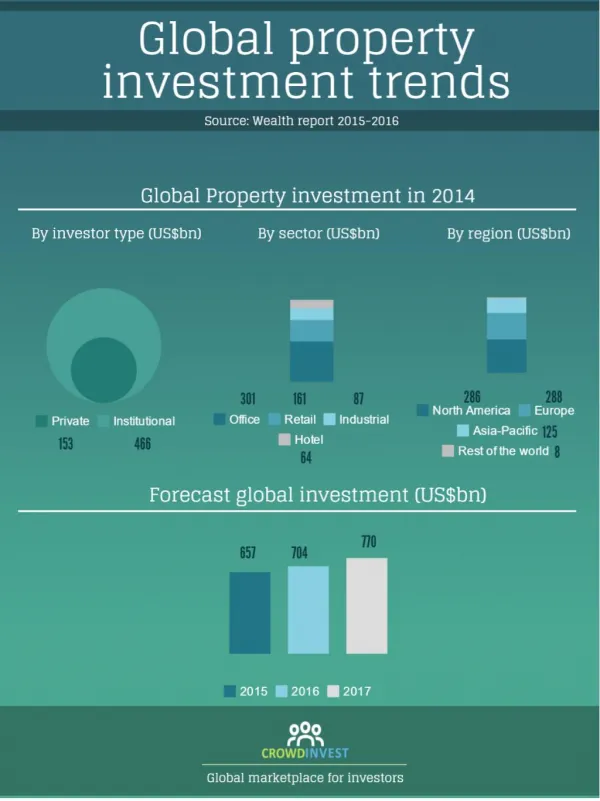
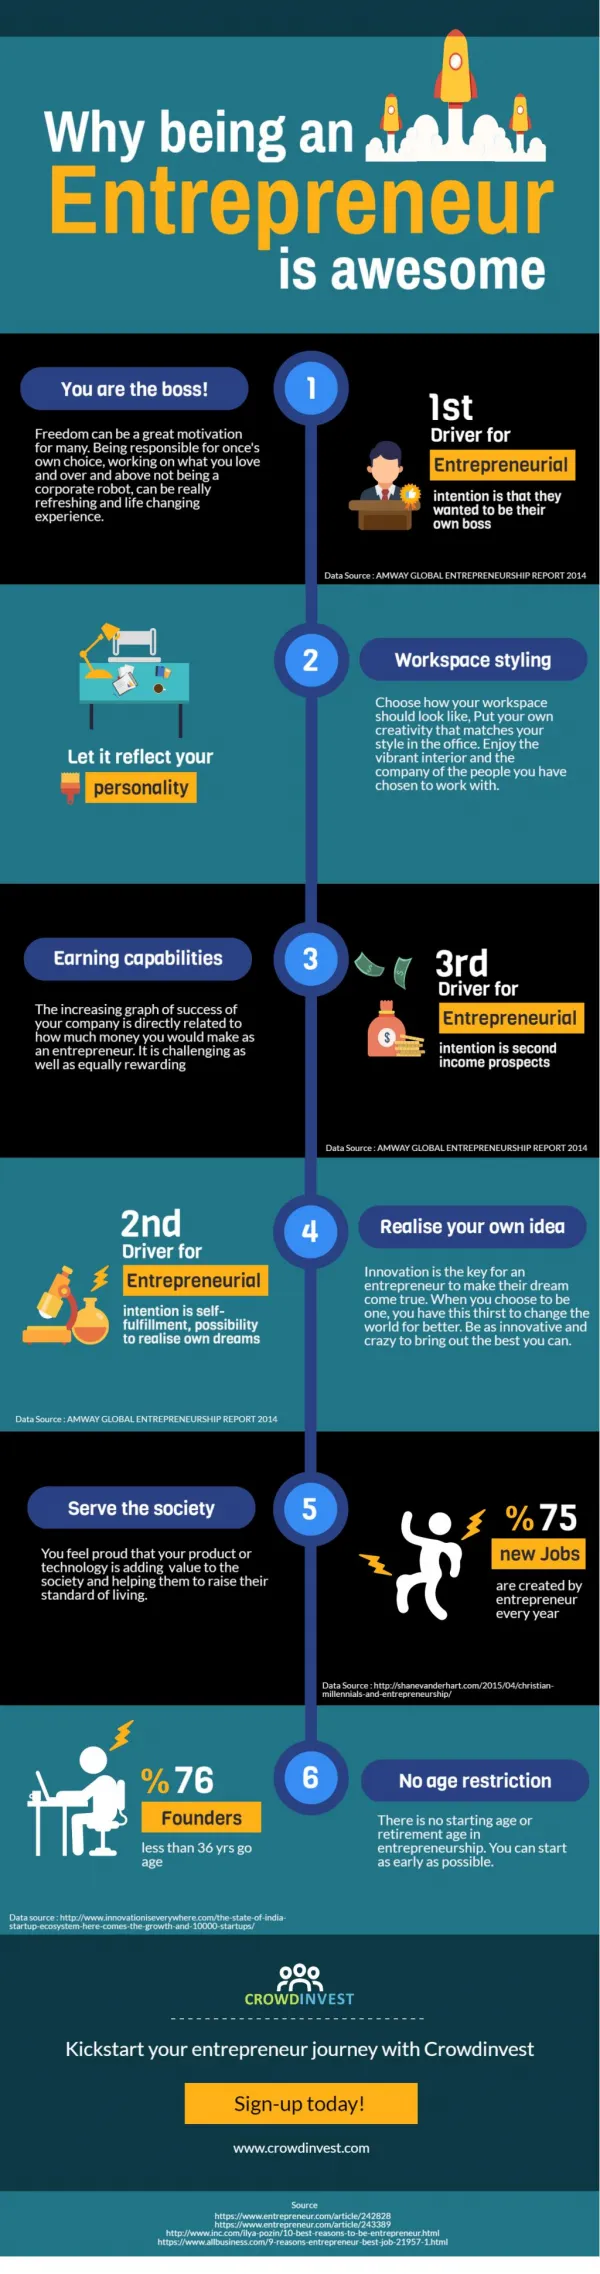
Explaining the Unexplainable: INFOGRAPHICS. Thale Dillon Director, Montana KIDS COUNT Bureau of Business & Economic Research University of Montana--Missoula. “Infographics are essentially any combination of information and image used to tell a story by visually representing data”.

E N D
Explaining the Unexplainable:INFOGRAPHICS Thale Dillon Director, Montana KIDS COUNT Bureau of Business & Economic Research University of Montana--Missoula
“Infographics are essentially any combination of information and image used to tell a story by visually representing data”. (IdealWare) What is anINFOGRAPHIC?
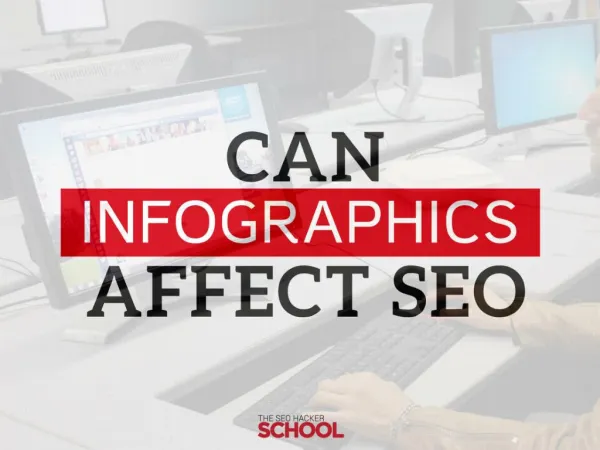
The purpose of infographics is to transform data into eye-catching, creative and accessible visuals that make viewers interested enough to care about your data. Why use INFOGRAPHICS?
Not easily shared SHAREABILITY Easily shared
Takes time to digest DIGESTIBILITY Quick and easy to scan
INTEREST Speaks to heads Speaks to hearts
APPEAL “Thunk” factor “Wow” factor
DEPTH OF CONTENT Superficial In-depth
As a COMPLEMENT to reports. Ways to use INFOGRAPHICS As a PREVIEW for a longer report. To tell a STORY. Have corresponding expectations.
DATA CLARITY KEYFEATURESOF A GOODINFOGRAPHIC:
From “Infographics for Outreach, Advocacy, and Marketing: From Data to Design”, Idealware (2013)
VISUAL CLARITY KEYFEATURESOF A GOODINFOGRAPHIC:
From “Infographics for Outreach, Advocacy, and Marketing: From Data to Design”, Idealware (2013)
PURPOSE KEYFEATURESOF A GOODINFOGRAPHIC:
Focal Point
Take- Away
“…designing good infographics isn’t as simple as it looks.” Babar Suleman
WARNING! * Montana KIDS COUNT * Bureau of Business & Economic Research * University of Montana
ONLINE TOOLS www.manyeyes.com infogr.am www.easel.ly www.visual.ly
infographics), which tends to show more illustrative graphics. For an idea of how you can use infographics for advocacy goals, take a look at RAD Campaign’s War on Women series (www. www.good.is/infographics
www.pinterest.com/idealware/infographic-report-examples www.pinterest.com/kanter/nonprofit-infographics www.good.is/infographics www.edwardtufte.com/ www.idealware.org www.feltron.com Online Resources
“The Wall Street Journal Guide to Information Graphics”, Dona M. Wong “Infographics for Outreach, Advocacy, and Marketing: From Data to Design”, Idealware.org “Blah, Blah, Blah: What to do when words don’t work”, Dan Roam “The Back of the Napkin”, Dan Roam PRINT Resources
Thale Dillon, Director Montana KIDS COUNT Bureau of Business & Economic Research University of Montana—Missoula thale.dillon@business.umt.edu www.montanakidscount.org www.bber.umt.edu