Download
1 / 1
10 likes | 122 Views
Assessing the performance of the CFSR by an ensemble of analysis Li Zhang 1,2 , Wesley Ebisuzaki 1 and Arun Kumar 1 1 NOAA Climate Prediction Center, Camp Springs, Maryland 2 Wyle Science Technology and Engineering, McLean, Virginia. Abstract.

E N D
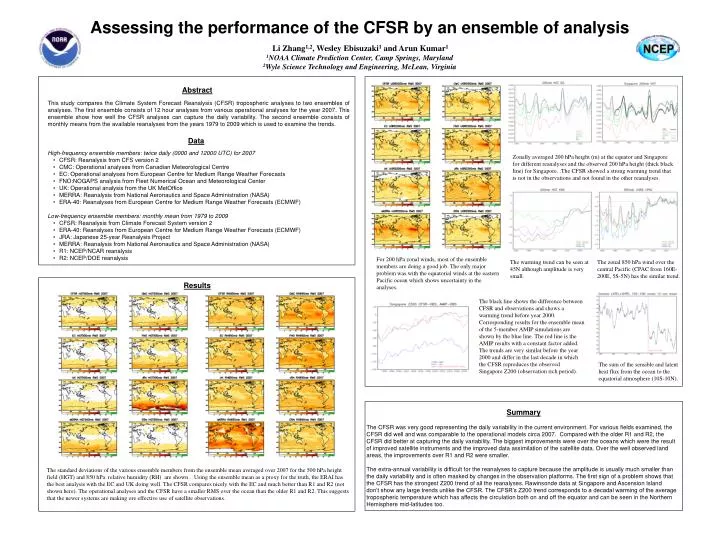
Assessing the performance of the CFSR by an ensemble of analysis Li Zhang1,2, Wesley Ebisuzaki1 and Arun Kumar1 1NOAA Climate Prediction Center, Camp Springs, Maryland 2Wyle Science Technology and Engineering, McLean, Virginia Abstract This study compares the Climate System Forecast Reanalysis (CFSR) tropospheric analyses to two ensembles of analyses. The first ensemble consists of 12 hour analyses from various operational analyses for the year 2007. This ensemble show how well the CFSR analyses can capture the daily variability. The second ensemble consists of monthly means from the available reanalyses from the years 1979 to 2009 which is used to examine the trends. Data • High-frequency ensemble members: twice daily (0000 and 12000 UTC) for 2007 • CFSR: Reanalysis from CFS version 2 • CMC: Operational analyses from Canadian Meteorological Centre • EC: Operational analyses from European Centre for Medium Range Weather Forecasts • FNO:NOGAPS analysis from Fleet Numerical Ocean and Meteorological Center • UK: Operational analysis from the UK MetOffice • MERRA: Reanalysis from National Aeronautics and Space Administration (NASA) • ERA-40: Reanalyses from European Centre for Medium Range Weather Forecasts (ECMWF) • Low-frequency ensemble members: monthly mean from 1979 to 2009 • CFSR: Reanalysis from Climate Forecast System version 2 • ERA-40: Reanalysesfrom European Centre for Medium Range Weather Forecasts (ECMWF) • JRA: Japanese 25-year Reanalysis Project • MERRA: Reanalysis from National Aeronautics and Space Administration (NASA) • R1: NCEP/NCAR reanalysis • R2: NCEP/DOE reanalysis Zonally averaged 200 hPa height (m) at the equator and Singapore for different reanalyses and the observed 200 hPa height (thick black line) for Singapore. .The CFSR showed a strong warming trend that is not in the observations and not found in the other reanalyses. For 200 hPa zonal winds, most of the ensemble members are doing a good job. The only major problem was with the equatorial winds at the eastern Pacific ocean which shows uncertainty in the analyses. The sum of the sensible and latent heat flux from the ocean to the equatorial atmosphere (10S-10N). The warming trend can be seen at 45N although amplitude is very small. The zonal 850 hPa wind over the central Pacific (CPAC from 160E-200E, 5S-5N) has the similar trend. Results The black line shows the difference between CFSR and observations and shows a warming trend before year 2000. Corresponding results for the ensemble mean of the 5-member AMIP simulations are shown by the blue line. The red line is the AMIP results with a constant factor added. The trends are very similar before the year 2000 and differ in the last decade in which the CFSR reproduces the observed Singapore Z200 (observation rich period). Summary The CFSR was very good representing the daily variability in the current environment. For various fields examined, the CFSR did well and was comparable to the operational models circa 2007. Compared with the older R1 and R2, the CFSR did better at capturing the daily variability. The biggest improvements were over the oceans which were the result of improved satellite instruments and the improved data assimilation of the satellite data. Over the well observed land areas, the improvements over R1 and R2 were smaller. The extra-annual variability is difficult for the reanalyses to capture because the amplitude is usually much smaller than the daily variability and is often masked by changes in the observation platforms. The first sign of a problem shows that the CFSR has the strongest Z200 trend of all the reanalyses. Rawinsonde data at Singapore and Ascension Island don’t show any large trends unlike the CFSR. The CFSR’s Z200 trend corresponds to a decadal warming of the average tropospheric temperature which has affects the circulation both on and off the equator and can be seen in the Northern Hemisphere mid-latitudes too. The standard deviations of the various ensemble members from the ensemble mean averaged over 2007 for the 500 hPa height field (HGT) and 850 hPa relative humidity (RH) are shown . Using the ensemble mean as a proxy for the truth, the ERAI has the best analysis with the EC and UK doing well. The CFSR compares nicely with the EC and much better than R1 and R2 (not shown here). The operational analyses and the CFSR have a smaller RMS over the ocean than the older R1 and R2. This suggests that the newer systems are making ore effective use of satellite observations.