Download
1 / 60
1.03k likes | 1.71k Views
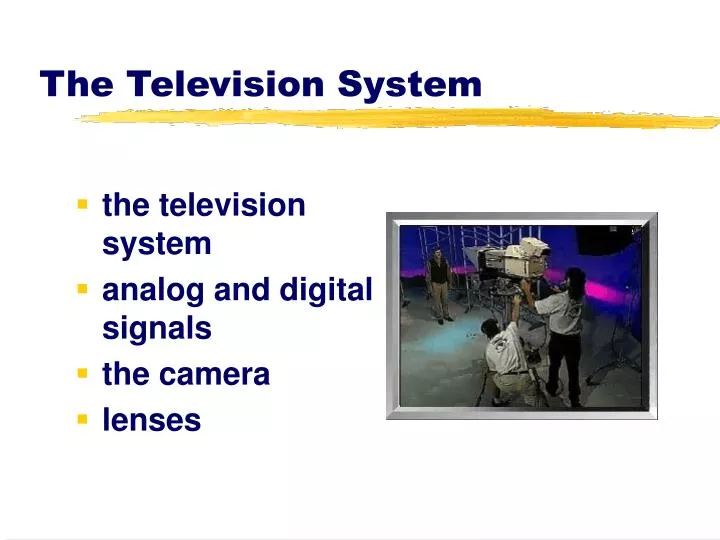
The Television System. the television system analog and digital signals the camera lenses. Monochrome Image. Approximately 500 dots per line. 525 Horizontal lines. 250,000 illumination points. Image formation by the TV receiver. dots all light gray. Line 91—. background.

E N D
The Television System • the television system • analog and digital signals • the camera • lenses
Monochrome Image Approximately 500 dots per line 525 Horizontal lines 250,000 illumination points
dots all light gray Line 91— background l. gray black l. gray Line 201— bg hair bg l. gray d. gray wht-blk-wht d. gray l. gray Line 451— bg suit shirt-tie-shirt suit bg Monochrome Image
Image formation for color TV Shadow Mask Blue dot Red gun Green dot Green gun Blue gun Red dot
Interlaced Scanning The electron beam first scans all odd-numbered lines, from left to right and top to bottom. This scanning cycle produces the firstfield (1/60th of a second). The beam jumps back to the top and scans all even-numbered lines. The second cycle produces the secondfield (1/60th of a second). The two fields make up a complete television picture, called a frame (1/30th of a second).
Interlaced & Progressive Scanning • In interlaced scanning, the beam reads every other line from top to bottom. Each scan produces one field. Two fields make up a complete frame. • In progressive scanning the beams reads every line from top to bottom. Each complete scan produces a television frame. Retrace lines are blanked out so they do not appear on the screen.
Vertical Detail Vertical stack = vertical detail Lines of Resolution To measure vertical detail, we count the vertical stack of horizontal lines. The more lines the vertical stack contains, the higher the resolution. The NTSC system has 525 lines, of which only 480 are visible on-screen. HDTV has 1,080 active (visible) lines.
Horizontal Detail Lines of Resolution To measure horizontal detail, we count the dots (pixels) of each horizontal line and then connect them vertically, which yields a horizontal stack of vertical lines. The more lines the horizontal stack contains, reading from left to right, the higher the resolution. This horizontal stack can contain many more lines (such as700) than can the vertical stack. Horizontal stack = horizontal detail
White and Black Levels The waveform monitor shows a graph of the luminance (black-and-white) portion of the video signal. It also shows the white level (the upper limit of the signal) and the black level (the lower limit of the signal). White level–100 Black level–7.5 Zero level
Analog and Digital Signals • The analog signal can be represented by a ramp that leads continuously to a certain height. • The digital signal can be represented by a staircase that lead to certain height in discrete steps.
Analog and Digital Signals Electronic signals as they originate in microphones and cameras areanalogin form. This means that the equipment detects signals in terms of continuing variations in relative strength oramplitude. In audio this would be loudness; in video it would be (among other things) the brightness component of the picture.
Analog and Digital Signals The top part of the illustration on the left shows how ananalogsignal can smoothly rise and fall over time to reflect changes in the original audio or video source. Compared to the digital signal at the bottom, an analog signal would seem to be the most accurate and ideal representation of the original signal.
Whenever a signal is reproduced and amplified,noiseis inevitably introduced which degrades the signal. In audio this can be in the form of a hissing sound; in video it appears as a subtle background "snow" effect. Analog - Noise The problem arises in the need for constant amplification and re-amplification of the signal throughout every stage of the audio and video process.
Convert to Digital By converting the original analog signals into digital form, this noise buildup can be virtually eliminated, even though it is amplified and "copied" thousands of times. Since digital signals are limited to the form of zeros and ones (0's and 1's), no "in between" information can creep in to degrade the signal.
Digitizing Diagram The digitization of an analog signal is a four-step process: • anti-aliasing • sampling • quantizing • coding.
1. Anti-aliasing • In anti-aliasing the extreme frequencies of the analog signal that are unnecessary for its proper sampling are filtered out.
2. Sampling Red line represents relatively low data loss Red line represents greater data loss • Sampling selects portions of the the original analog signal. A low sampling rate transforms the ramp into a few large steps. Much of the original signal is lost • A high sampling rate selects more parts of the original signal. The ramp is made of more, smaller steps, making the steps look more like the original ramp. The higher the sampling rate, the higher the signal quality.
3. Quantizing • Quantizing assigns the selected signal samples a fixed position. This is the step building phase. Each step gets a particular decimal number, indicating its height. • Low sampling rate: several large steps. • High sampling rate: many small steps.
4. Coding or Encoding • Coding assigns each step a binary number: 0 or 1.
DTV Scanning Formats • 480p 480 lines progressively scanned. • 720p 720 lines progressively scanned • 1080i 1,080 lines with interlaced scanning. • All have 16:9 aspect ratio but can be switched to the traditional 4:3 ratio.
Additive Color Mixing Red Yellow Magenta White Green Blue Cyan
Saturation (color strength) Chroma or chrominance Color Attributes Hue Brightness (Light reflectance—how light or dark a color appears on the grayscale) Luminance
Parts of the camera Viewfinder Imaging device Lens Camera
Basic camera functions Viewfinder Object Lens Processor Amplifier Beam splitter Charge-coupled devices (CCDs)
Camera Chain Sync Generator CCU Camera head Power supply
Beam Splitters CCD for red channel Beam-splitting prism block CCD for green channel Zoom lens CCD for blue channel
Striped and Mosaic Filters Striped RGB Filter Mosaic RGB Filter Most consumer cameras have only one imaging chip (CCD) and use a striped or mosaic-like filter instead of the prism block to divide the white light into RGB color beams. Each of these colored beams is then transduced (changed) by the single CCD into the RGB signals.
Storage area Imaging area Output area Light input Output amplifier Widow with pixels CCD Process The charge-coupled device consists of an imaging area (the window), a storage area, and an output area. The imaging area contains the pixels, the storage area stores the pixel charges, and the output area delivers them to the amplifier to form the video signal.
Brightness: Insufficient Contrast Although the hue is sufficiently different for this letter to show up on the blue background of the color television set, it is barely readable on a black-and-white receiver. The brightness contrast is insufficient for good monochrome reproduction.
Brightness: Good Contrast The hues in this picture have enough difference in brightness to show up equally well on both a color and black-and-white receiver.
Focal Length Distant image in focus Optical center of lens Focal length Lens with focus set at infinity CCD imaging device
Wide-Angle & Narrow-Angle Zoom Positions Wide angle Narrow angle
The Law of Lenses The shorter the lens... The longer the lens... the narrower the angle... the wider the angle... the more in the picture... the less in the picture... the smaller the subject the larger the subject
Elements of a Variable Focal Length Lens Focusing lens Beam-splitting prism Variator lens Variator lens Relay lens Focusing lens
Exposure Control Aperture Iris
Exposure Control Aperture Iris
f-Stop—2.8 The smaller the f-stop number the larger the iris opening
f-Stop—16 The larger the f-stop number the smaller the iris opening
Depth-of-Field Point of Focus The Depth-of-Field is the area within which all objects, although located at different distances from the camera, are in focus. Depth-of-Field (area in focus)
Depth-of-Field z-axis in focus z-axis in focus
IN FOCUS Large Depth-of-Field IN FOCUS camera
Narrow Depth-of-Field IN FOCUS camera
Depth-of-Field is influenced by… • aperture setting • subject to camera distance • focal length of the lens