Download
1 / 23
230 likes | 231 Views
This document discusses the lessons learned in OOI data management and QA/QC, including data flow, evaluation procedures, metadata, and future plans. It also introduces the OOI team and provides information on data products and essential ocean variables.

E N D
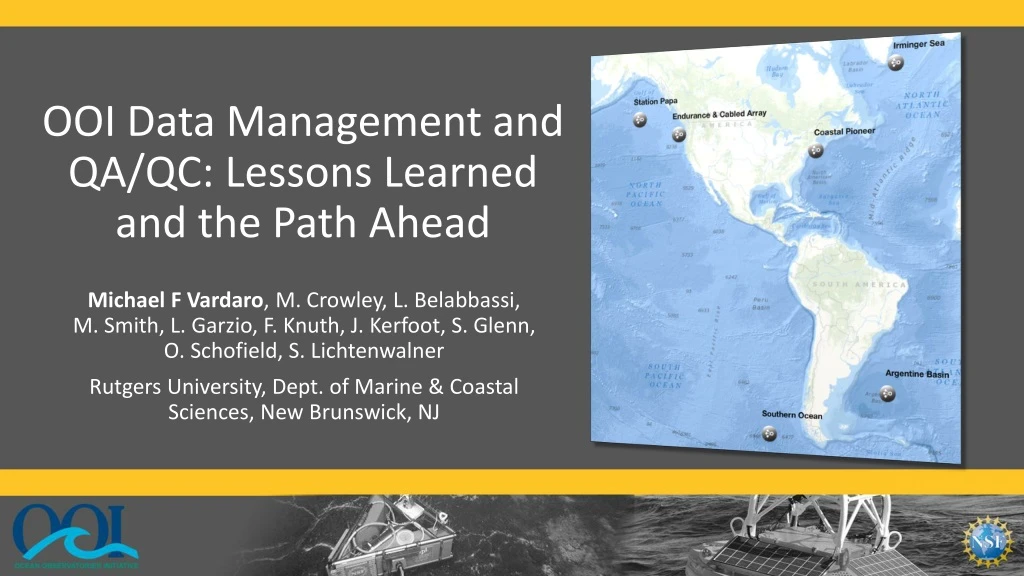
OOI Data Management and QA/QC: Lessons Learned and the Path Ahead Michael F Vardaro, M. Crowley, L. Belabbassi, M. Smith, L. Garzio, F. Knuth, J. Kerfoot, S. Glenn,O. Schofield, S. Lichtenwalner Rutgers University, Dept. of Marine & Coastal Sciences, New Brunswick, NJ
Table of Contents: • OOI Data Evaluation Team • OOI Data Flow • OOI Data Evaluation Procedures • Lessons Learned • Metadata • Communications • QA vs. QC • Future Plans
OOI By the Numbers 7 50 33 >850 >2500 >100K Arrays Stable Platforms Moorings, Profilers, Nodes Mobile Assets Gliders, AUVs Instruments Science Data Products Science/Engineering Data Products
Data Team Leadership & Oversight CI PI Manish Parashar Science/User PI Oscar Schofield Science/User PI Scott Glenn Program Management System Engineering PM RU – Ivan Rodero Project Coordinator Caroline McHugh Science PM RU – Mike Crowley RDI2 COOL Data Team Software Team System Team User Services Team Software Team Manager Bill Kish IT Manager Juan José Villalobos Data Manager Mike Vardaro Technical Help Desk & Education-Outreach Sage Lichtenwalner Software Test Eng. Matthew Danku Network Engineer Jim Housell Data Evaluator Friedrich Knuth Asst. Data Manager Leila Belabbassi Software Configuration & Maintenance Janeen Pisciotta System Administrator Aamir Jadoon Data Evaluator Lori Garzio Data Evaluator Mike Smith Rutgers Support OOI Operations: 12 FTEs OOI Management: Steady State: 1 FTE
Data Flow AGU Ocean Sciences 2016
OOI Data Product Levels • Raw data: The datasets as they are received from the instrument • May contain multiple L0, L1, or L2 parameters, data for multiple sensors, and be in native sensor units • Always persisted and archived by the OOI • Example: format 0 binary file from an SBE-37IM on a Global Flanking Mooring. • Level 0 (L0): Unprocessed, parsed data parameter that is in instrument/sensor units and resolution • Sensor by sensor (unpacked and/or de-interleaved) and available in OOI supported formats (e.g., NetCDF) • Always persisted and archived by the OOI • Example: SBE-37IM Temperature portion of the hex string • Level 1 (L1): Data parameter that has been calibrated and is in scientific units • QC may be applied at this level, utilizing simple automated techniques or human inspection • Actions to transform Level 0 to Level 1 data are captured and presented in the metadata of the Level 1 data • Example: SBE-37IM Temperature converted from hex to binary and scaled to produce degrees C • Level 2 (L2): Derived data parameter created via an algorithm that draws on multiple L1 data products • Products may come from the same or from separate instruments • Example: SBE-37IM Density and Salinity
Data Flow Example: Pioneer Profiler CTDPF DOFST FLORT PARAD VEL3D WHOI Ocean Profiler Controller Inductive Modem OMC Data Server Instrument Platform Controller Telemetry OMC Platform Shore Server rsync Iridium MOPAK RTE Inductive Modem ADCPS/T Rutgers User Data Files from CGSN RU Acquisition Point Server Dataset Agent Driver Data Product Algorithm uFrame Database GUI
Data Processing Flow QC Parameters (RU) A/A Parameters (MIOs) Cabled Ingest Config (MIOs/SD) Preload Database (All) Data from RSN Streaming User Recorded Data Product Algorithms, QC, A/A (Omaha) Acquisition Point Server (RU) Dataset Agent Driver (Omaha) uFrame Database (Omaha) GUI (ASA-RPS) Data files from CGSN (Telemetered and Recovered) Ingestion Sheet (.csv) (MIOs/RU) Cal Sheets (MIOs) Algorithms (OSU)
Data Access Points • Data Portal (GUI) • THREDDS Server • Aggregated data products in NetCDF and CSV • ERDDAP (Spring-Summer 2016) • Raw data files (Spring 2016) • Shipboard Data • Large Format Data • Still Camera & HD Video • Seismic Sensors • Hydrophones • Bioacoustic Sonar • Direct Pass to community organizations (e.g. seismic to IRIS)
OOI Essential Ocean Variables (EOVs) • All Arrays, all platforms: • CTD data products (Temperature, Conductivity, Pressure, Density, Salinity) • Dissolved Oxygen • ADCP (all series) • Bulk Meteorology (all products) • Surface Wave Spectra – significant wave height • FluorometricProducts (CDOM/Chlorophyll/Backscatter) • Nitrate • Seawater pH • In-Water and Air/SeapCO2 • Cabled Array EOVs (these instruments are only on the Cabled Array): • HD Camera Products • Bottom Pressure/Tilt Products • Seafloor Pressure • Low-Frequency Hydrophone Products • Vent Fluid and Particulate DNA Sampler – D1000 Temperature Products
QC Procedures and Tools AGU Ocean Sciences 2016
OOI Automated QC Procedures • 7 automated QC algorithms can produce 8 flags (including logical “or” which combines flags) which are plottable and are included in downloaded files • Coded based on specifications written by OOI Project Scientists, derived from QARTOD manuals and other observatory experiences • Algorithms refer to “lookup tables” assembled by OOI Project Scientists with input from subject matter experts: https://github.com/ooi-integration/qc-lookup Global Range Test Local Range Test Spike Test Stuck Value Test Trend Test Temporal Gradient Test Spatial Gradient Test(Profile)
QC Challenges • Local range values will require ongoing gathering of environmental data for each platform • Spike test is currently very simple, and needs tweaking to avoid false positives/negatives (especially in biological data) and to work with certain data types • Trend test may not work as designed, because it requires the system to compare data prior to the user request date • Gradient test is complicated to apply, requires 2D dataset • Not all QC algorithms apply to all data products – ongoing review with Project Scientists • The QC algorithms do NOT trigger alerts in the system • Alerts/alarms only trigger when new data is telemetered/streamed • Can set alerts on L1/L2 data streams based on Global/Local range values
Data Evaluation Procedures & Tools • Data Management Plan (Spring 2016): • 1102-00000_Data_Management_Plan_OOI • Data QA/QC and Sampling Plan: • 1102-00300_QAQC_Cal_Physical_Samples_OOI • Sampling Strategy Document: • 1102-00200_Observation_and_Sampling_Approach_OOI • Data Product Specifications: • 1341-000xx (DPS) and 1342-000xx (Data Flow) • Data Product and QC Algorithms: • github.com/ooici/ion-functions/tree/master/ion_functions/data • github.com/ooici/ion-functions/tree/master/ion_functions/qc • Quality Control Lookup tables: • github.com/ooi-integration/qc-lookup • Data Team download and plotting tools: • github.com/najascutellatus/plot-nc-ooi
Lessons Learned AGU Ocean Sciences 2016
Metadata standards • Process of defining, collecting, and determining presentation of metadata has been ongoing for longer than anticipated • Software developers interpreted metadata standards differently than intended by the science requirements • Climate and Forecast (CF-1.6) standards adopted • Presentation in NetCDF header is incomplete but being improved • Provenance contained within file, which is not standard • Encoded in JSON format, requires extraction • Contains error notifications and information on how product was created • More formatting work needs to be done
Communication • The main method of communication from the data team to users is via annotation (requires enhancement) • Main method of communication from users to data team is through help desk requests (via website) • Also needed to standardize and improve communication between data team and Marine Implementing Organization personnel
QA vs. QC • Quality Control is a product check to identify flaws or defects • Quality Assurance is a defined process used to diagnose why a product is flawed or being produced incorrectly • The data team has had to become increasingly familiar with the end-to-end production of data products • Wider teamwork required to track (sometimes mysterious) issues back to a specific cause • Software error or missing data vs… • Instrument miscalibration by vendor vs… • Instrument settings changed during deployment vs… • Mooring run over by ship
Future Plans AGU Ocean Sciences 2016
Near-Term Priorities • Deliver high quality data to the community, enabled and accelerated via feedback and community “eyes” on the products • Requires transparency in software releases, QC procedures, and documentation • Hybrid data delivery approaches to augment asynchronous data delivery via GUI, using THREDDS, ERDDAP, etc. • Organize a cross-project team to define and develop a method for post-recovery secondary calibration. This group will rely on external community input. • Several high value and high interest OOI datasets (e.g. bioacoustics, covariance flux measurements, vent fluid chemistry) will require entraining the external community in data quality and delivery discussions • Addition of a data forum and additional communications to external scientists • OOI is more then a collection of sensors: an ongoing distributed community discussion
OOI at Oceans 2016 • TOWN HALL TOMORROW AT 12:30pm - Rooms 220-221 • Consortium for Ocean Leadership & OOI Booth 611 in Exhibitor Hall • Posters Today at 4pm • OD14A-2394 - OOI Data Access and Visualization via the Graphical User Interface - Lori Garzio • OD14A-2397 - The Ocean Observatories Initiative: Unprecedented access to real-time data streaming from the Cabled Array through OOI Cyberinfrastructure - Friedrich Knuth • OD14A-2396- OOI Data Acquisition Functions and Automated Python Modules - Mike Smith • OD14A-2399– OOI Data Pre-Processing: Diagnostic Tools to Prepare Data for QA/QC Processing - Leila Belabbassi • Poster Thursday 4pm • ED44B-1728: The OOI Ocean Education Portal: Enabling the Development of Online Data Investigations - Sage Lichtenwalner AGU Ocean Sciences 2016
Questions? • OOI Main Web site:http://oceanobservatories.org • Data Portal: http://ooinet.oceanobservatories.org Mike Vardaro, Data Manager, OOI CI Data Team vardaro@marine.rutgers.edu Acknowledgements: NSF, COL, Rutgers University, University of Washington, WHOI, Oregon State University, RPS-ASA, Raytheon, UCSD/SIO AGU Ocean Sciences 2016