Download
1 / 17
170 likes | 180 Views
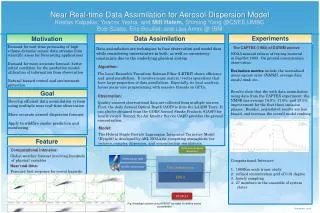
This study focuses on developing intelligent data thinning algorithms to reduce the volume of data in real-time data assimilation processes. By identifying and retaining the most important data points, these algorithms improve analysis quality while reducing computational resources required. The algorithms were tested using synthetic and real satellite observations, demonstrating their effectiveness in maintaining analysis fidelity.

E N D
INTELLIGENT DATA REDUCTION ALGORITHMS FOR REAL-TIME DATA ASSIMILATION Xiang Li, Rahul Ramachandran, Sara Graves ITSC/University of Alabama in Huntsville Bradley Zavodsky ESSC/University of Alabama in Huntsville Steven Lazarus, Mike Splitt, Mike Lueken Florida Institute of Technology May 5, 2009
Data Reduction It is a common practice to remove a portion of or combine high spatial and temporal resolution observations to reduce data volume in DA process, due to High computation resources required for large volume data set (exponential increase with data volume) Data redundancy in large volume high resolution observations Local spatial correlation of satellite data observation data resolution exceeds assimilation grid resolution Reducing data redundancy may improve analysis quality (Purser et al., 2000)
Computational Resources Required for Data Assimilation Lot Computational Resources Little Analysis Technique Successive Corrections Statistical Interpolation 3D-Var 4D-Var Lot Data Volume Little Horizontal Resolution 80 km 1km
Need for ‘new’ Data Reduction Techniques Current data thinning approaches Sub-sampling Random Sampling Super-Obing (subsampling with averaging) Limitations All data points are treated equally Information contents that observation data contain and their contributions to data analysis performance may be different Intelligent Data Thinning Algorithms Reduces number of data points required for an analysis Maintains fidelity of the analysis (keeps the most important data points)
Example Simple subsampling strategies can be susceptible to impact from missing ‘significant’ data sample. High Data Volume from satellite platforms ( e.g. infrared based SST, scatterometer winds) carry redundant data. Computationally Expensive! Same data subsampling interval, but shifted. Analyses derived from simple subsampling of data can be inconsistent and are not optimal in efficiency.
Intelligent data thinning algorithms • Objective: reserve samples in the thinned data set that have high information content and large impact on analysis. • Assumption: samples with high local variances contain high information content • Approach: Use synthetic test to determine and validate the optimal thinning strategy and then apply to real satellite observations • Synthetic Data Test: Truncated Gaussian • Real Data Experiment: Atmospheric Infrared Sounder (AIRS) profiles
Synthetic Data Test: Truncated Gaussian • Explicitly defined truth and background fields • Direct thinning method • 35 observations sampled to find the 5 observations yielding the best analysis (1D variational approach) • 325,000+ unique spatial combinations • First guess: base of Gaussian function • Observations: created by adding white noise to truth optimal observation locations truth analysis first guess
Synthetic Data Test: Truncated Gaussian (cnt’d) • Optimal observation configuration retains data at the: • peak • gradient • anchor points (where gradient changes most sharply) • Dependent on key elements of the analysis itself: • length scale (L) • quality of background and observations Lesson Learned: Thinned data samples should combine homogeneous points, gradient points, and anchor points for optimal performance, and a dynamic length scale should be applied to each thinned data set.
Intelligent Data Reduction Algorithms • Earlier versions of intelligent data thinning algorithms (IDT, DADT, mDADT) • Density-Balanced Data Thinning (DBDT) • Three metrics are calculated for data samples and samples are put into priority queues for the three metrics • Thermal Front Parameter (TFP): High value of TFP indicates rapid change of temperature gradient and ‘anchor’ samples • Local Variance (LV): high values indicate gradient regions • Homogeneity: low values indicate homogeneous regions • Data selected from the three metrics:user determines the portions of samples from these metrics • Radius of impact (R): used to control uniform spatial distribution of thinned data set. Distance between any two samples needs to be larger than R • Data selection process:select top qualified samples from priority queues. Start with TFP queue, followed by LV queue and homogeneity queue • DBDT algorithm performs best in these thinning algorithms
AIRS & ADAS: Our Real-World Testing Ground • Atmospheric Infrared Sounder (AIRS) • NASA hyperspectral sounder • generates temperature and moisture profiles with ≈ 50-km resolution at nadir • each profile contains a pressure level above which quality data are found • ARPS Data Assimilation System (ADAS) • version 5.2.5; Bratseth scheme • background comes from a short-term Weather Research and Forecasting (WRF) model forecast • error covariances: • background: standard short-term forecast errors cited in ADAS • observation: from Tobin et al. (2006)* AIRS validation study • dynamic length scale (L) calculated from average distance of nearest observation neighbors *D. C. Tobin, H. E. Revercomb, R. O. Knuteson, B. M. Lesht, L. L. Strow, S. E. Hannon, W. F. Feltz, L. A. Moy, E. J. Fetzer, and T. S. Cress, “ARM site atmospheric state best estimates for AIRS temperature and water vapor retrieval validation,” J. Geophys. Res., D09S14, pp. 1-18, 2006.
Thinning Strategies (11% of full) • Subsample: • Takes profile with most retrieved levels within a 3x3 box • Random: • Searches observations and ensures that retained observations are thinned to a user-defined distance • 10 permutations performed to create an ensemble • DBDT: • thins on 2-D pressure levels using equivalent potential temperature; then levels are recombined to form 3-D structure • Thinning uses Equivalent Potential Temperature (θe) to account for both temperature and moisture profiles
Case Study Day: 12 March 2005 • 700 hPa temperature gradient in observations and background over midwest and northern Gulf of Mexico • Observations and background show similar patterns 700 hPa AIRS temperature observations 700 hPa WRF forecast temperatures (bckgd)
700 hPa Temperature Analysis Comparison • Overall analysis increments are ±1.5oC over AIRS swath • Largest differences between analyses in upper midwest and over Southern Canada Random Subsample DBDT
Quantitative Results (Full vs. Thinned) • Computation times are 50-70% faster for the thinned data sets • MSEs compare analyses between full and each thinned • DBDT is superior analysis with least observations: • has a longer computation time (thinning algorithm more rigorous) • cuts MSE almost in half with 1/10 the observations of the full
Conclusions • Intelligent data thinning strategies are important to eliminate redundant observations that may hinder convergence of DA schemes and reduce computation times • Synthetic data tests have shown that observations must be retained in gradient, anchor, and homogeneous regions and that results are dependent on key elements of the analysis system • Analyses of AIRS thermodynamic profiles using different thinning strategies yields the DBDT as the superior thinning technique
Future Work • Manuscript in review with Weather and Forecasting (AMS) • Testing forecasts spawned from the various thinned analyses to see if superior DBDT analysis produces the best forecasts • Demonstration of algorithm capabilities with respect to real-time data dissemination • Use of gradient detecting portion of algorithm for applications in locating cloud edges for radiance assimilation
Thank you for your attention. Are there any questions?