1 / 1

任务五: 利用折线图表呈现分析结果

任务五: 利用折线图表呈现分析结果. 3.图表类型的灵活运用 任务 :将评优活动各总成绩表使用 折线图表 表达出来。 分析该图表,提取有价值的信息。 从图表中看出:哪个班的总体成绩最好?哪个班进步最快?每个班的发展趋势是如何?.

thalia
Download Presentation

任务五: 利用折线图表呈现分析结果

An Image/Link below is provided (as is) to download presentation Download Policy: Content on the Website is provided to you AS IS for your information and personal use and may not be sold / licensed / shared on other websites without getting consent from its author. Content is provided to you AS IS for your information and personal use only. Download presentation by click this link. While downloading, if for some reason you are not able to download a presentation, the publisher may have deleted the file from their server. During download, if you can't get a presentation, the file might be deleted by the publisher.

E N D

Presentation Transcript


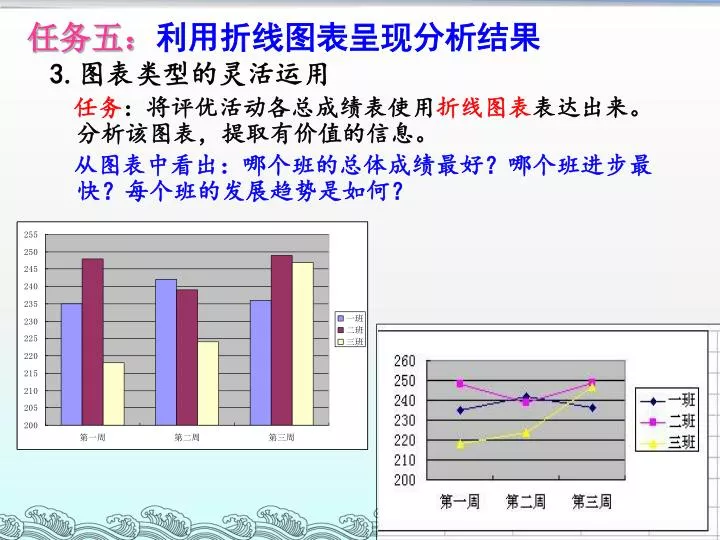
  1. 任务五:利用折线图表呈现分析结果 3.图表类型的灵活运用 任务:将评优活动各总成绩表使用折线图表表达出来。 分析该图表,提取有价值的信息。 从图表中看出:哪个班的总体成绩最好?哪个班进步最快?每个班的发展趋势是如何?

More Related