Download
1 / 6
60 likes | 134 Views
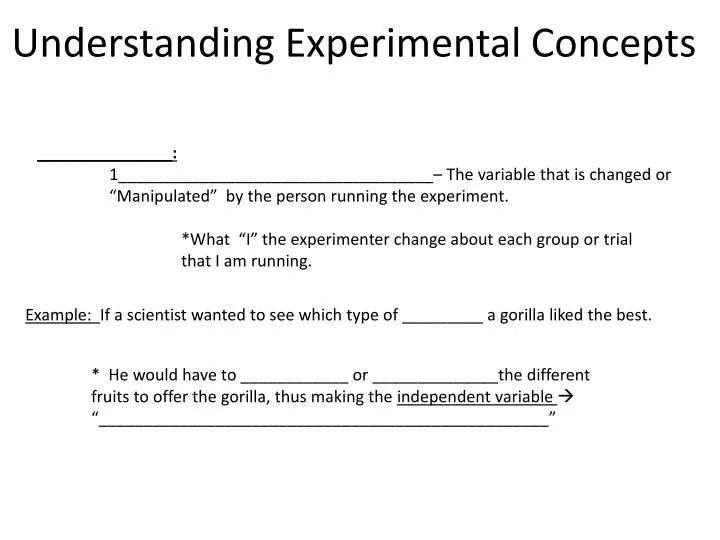
_______________: 1___________________________________– The variable that is changed or “Manipulated” by the person running the experiment. *What “I” the experimenter change about each group or trial that I am running. Understanding Experimental Concepts.

E N D
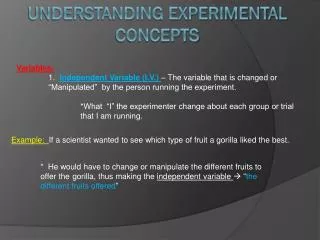
_______________: 1___________________________________– The variable that is changed or “Manipulated” by the person running the experiment. *What “I” the experimenter change about each group or trial that I am running. Understanding Experimental Concepts Example: If a scientist wanted to see which type of _________ a gorilla liked the best. * He would have to ____________ or ______________the different fruits to offer the gorilla, thus making the independent variable “__________________________________________________”
___________________________________= the variable that changes as a result of the changes made to the I.V. • Simpler put the “__________________________you are looking For” • Usually something that can be “___________________” Same Example: If a scientist wanted to see which type of fruit a gorilla liked the best. * The _____________________________________________would be how much of each fruit the gorilla ate (Indicating His Favorite), thus making the dependent variable “___________________________________________________________”
Data Tables, Graphs & Variable Locations: Graph: Data Table: _____is always on the ____________! ______is the columns to the right of the _____& the ______ is located on the ___________in a graph! ______is most often the _____Column.
Control Groups & Factors that are Kept the Same in an Experiment: • __________________: The Group used for ________________in an experiment, the one _______ changed by the experimenter. • Example: A doctor tested the effectiveness of pain killers on a patient that was in chronic pain. The doctor gave the patient a “placebo,” sugar pill the first day, Tylenol the second day, and Advil the third day. He rated the patients level of pain on a scale of 1-10 (10 being the worst). Each day the patient was told to rest on the couch, eat 3 meals and watch only Oprah, Sportscenter or the Food Network. • What is the Control Group in this experiment? • 1st – Find the ______ = _______________________________ 2nd – Find the Group, Trial or Part of the I.V. that is ______changed and can be used for _______________ = “_____________” ______________– It is not a Pain Killer!
Factors that are kept the same in an Experiment: • * Each “_________________________________” will always have one thing change _______and the rest of the factors in the experiment _____________________for each group being tested. • Same Example: A doctor tested the effectiveness of pain killers on a patient that was in chronic pain. The doctor gave the patient a “placebo,” sugar pill the first day, Tylenol the second day, and Advil the third day. He rated the patients level of pain on a scale of 1-10 (10 being the worst). Each day the patient was told to rest on the couch, eat 3 meals and watch only Oprah, Sportscenter or the Food Network. * What factors in this experiment are kept the same for the patient? Each day the patient was told to ____________________, ____________________and ____________________ Oprah, Sportscenter or the Food Network.
Data & Drawing Conclusions: • Data can be represented in 2 ways: • ___________________: Numbers, Measures, Values • Ex. ______ rabbits • Qualitative: __________________ or listed characteristics • Ex. The rabbits were __________ and ____________ • Conclusions: Statements drawn after ________________ your data. • * Must be “__________________” with actual data! Using this data table what would be a good conclusion supported with data? Conclusion = The Gorillas favorite fruit must be _______________ because he ate ___ bananas compared to ___oranges & ___apples in a day.