Download
1 / 29
290 likes | 508 Views
Logistics Cost. Professor Goodchild Spring 11. Initial gains from deregulation (restructuring of networks), stalling in the mid-90s dropping off again after 9/11, but increasing with congestion and fuel prices After 2003. Logistics Decisions. Improve/change your existing system

E N D
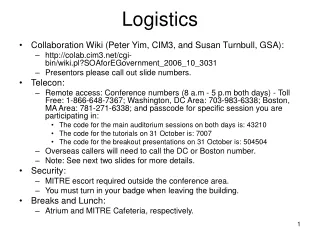
Logistics Cost Professor Goodchild Spring 11
Initial gains from deregulation (restructuring of networks), stalling in the mid-90s dropping off again after 9/11, but increasing with congestion and fuel prices After 2003.
Logistics Decisions • Improve/change your existing system • Create a new system • Comparison with other systems • Evaluate choices in your own system
Transportation Goals • Reduce cost (5-10% of sales) • Meet reliability goals • Meet service quality goals • Simplify operations • Increase sustainability
Integration of Logistics into Business Operations • Operational, or daily decisions are made by comparing transportation and inventory costs • Strategic, or long term decisions are made by comparing logistics costs (transportation and inventory) to manufacturing and production costs • Lengthening of supply chains as transportation cost decreased and new opportunities to reduce manufacturing cost were found
Strategic Decisions • System design, acquisition of resources, based on aggregated data • Tactical Decisions • Monthly or quarterly decisions, production and distribution planning, based on disaggregated data • Operational Decisions • Daily decisions, based on very detailed data
Methods • Benchmarking • Simulation • Optimization • Continuous approximation
Considerations • How accurate is your input data? • How do errors propagate in your analysis? • What have you learned from the analysis? • What kind of decision will you be making? • How does your analysis handle variability? • How well can your results be communicated? • Can your method be solved, or is your answer an approximation? • What level of complexity can be managed?
Logistics Decisions • Should I open a new facility? Where? • How many trucks should I buy? What size? • How much should be manufactured? Where? • How often should I send out delivery trucks? • What mode of transportation should I use? • How many drivers do I need today?
How does REI get goods to market? West Coast Port Asian Factories Distribution Center Destination Store Container on marine vessel Short or Long-haul truck Drayage truck In transit inventory
Cycle Inventory: the average amount of inventory used to satisfy demand between receipt of supplier shipments. The size of the cycle inventory is a result of the production or purchase of material in large lots. Companies produce or purchase in large lots to exploit economies of scale in the production, transportation, or purchasing process. With the increase in lot size, however, also comes an increase in carrying costs. The basic trade-off supply managers face is the cost of holding larger lots of inventory (when cycle inventory is high) versus the cost of ordering product frequently (when cycle inventory is low). Some of this inventory may be in-transit, while some may be inventory-at-rest. • Safety inventory: inventory held in case demand exceeds expectation; it is held to counter uncertainty. If they have too much safety inventory, goods go unsold and may have to be discounted. If the company has ordered too little safety inventory, however, the company will lose sales and the margin those sales would have brought. Therefore, choosing safety inventory involves making a trade-off between the costs of having too much inventory and the costs of losing sales due to not having enough inventory. Generally this inventory is inventory-at-rest, so that it is immediately available.
How do goods get to market? West Coast Port Asian Factories Distribution Center Destination Store Container on marine vessel Short or Long-haul truck Drayage truck Transportation cost is typically much less significant than the reductions in manufacturing.
Logistics Costs • Transportation cost • The cost incurred through the need to move products over space. • In a vehicle, with a forklift, etc. • Inventory cost • The cost incurred through the need to hold goods over time. • In a vehicle, in a distribution center, etc.
In-transit inventory or pipeline inventory: inventory that is in the process of movement from point of receipt or production and between points of storage and distribution. • Inventory-at-rest: inventory that is NOT in the process of movement from point of receipt or production and between points of storage and distribution, rather it is stationary, typically at a production facility, warehouse, distribution center, or consumption facility.
How does REI get goods to market? West Coast Port Asian Factories Distribution Center Destination Store Container on marine vessel Short or Long-haul truck Drayage truck In transit inventory
Follow the path of an item • Carried from production area to storage area • Held in temporary storage • Loaded into transport vehicle • Transported to the destination • Unloaded, handled, and held for consumption
What incurs cost? • Overcoming distance (motion): • transportation cost (over the road/rail) • handling cost (through a terminal, in and out of vehicles) • Overcoming time (holding): • holding cost: • Rent (proportional to D’H) • Waiting (value*time*interest rate) • In transit • At rest How you calculate the value depends on the analysis you are doing (cost or price) We will include all costs, regardless of who pays them (we are designing systems)
Cumulative Number of Items Diagram Production (rate D’) shipments cumulative number of items An item is a fixed quantity of infinitely divisible quantity (e.g. person, parcel, case of beer) H tm Consumption (D’) arrivals time Consider units on area
Queue Discipline • FIFO: First In First Out • LIFO: Last In First Out • Others If LIFO inventory cost is usually underestimated
Holding cost: Rent • proportional to max. accumulation • Independent of flow rate, D’ • Proportional to max. time between dispatches
Holding cost: Waiting • Cost associated with delay to items • ciHi + citm • Stationary + pipeline inventory • Determining ci is difficult
Transportation Cost • Shipment cost has fixed and variable portions: cf + cvv (v is number of items) • Fixed cost: driver wage • Variable cost: increased fuel consumption • Cost for n shipments: cfn + cvV (V is total items across shipments, n is number of shipments)
Transportation cost • Cost per item: (cfn + cvV)/V = cf/vavg+cv • Economies of scale from sharing fixed cost • vavg=D’Havg so cost per item is (cf/D’Havg)+cv • Transportation cost per item decreases with increasing average headway • Holding cost increased with maximum headway • ciHi + citm
Shipments should be spread so as to minimize the maximum (all the same)
Transportation cost and distance • cf (fixed shipment cost) is independent of v (items) • both cf and cv are typically functions of distance (d) • cf=cs+cdd • cv=c’s+c’dd
Transportation cost and distance • cf=cs+cdd • cv=c’s+c’dd • Cost for n shipments: cfn+cvV • csn+cddn+c’sV+c’ddV • Add cost of multiple stops: cs(1+ns)n+cddn+c’sV+c’ddV So small we neglect it
Transportation cost • Cost per item (divide by nvavg): • cs(1+ns)/vavg+cdd/vavg+c’s or • cs(1+ns)/D’Havg+cdd/D’Havg+c’s • If headways vary a lot so do shipment sizes, and therefore truck sizes, better to use consistent truck sizes
Capacity Restrictions Trans. Cost Per shipment vcv cf Slope is cost per item, lowest when truck full vmax – number of items that will fit in vehicle shipment size
Relationship to size Magnitude of fixed and variable cost determine most economic choice as a function of shipment size. Trans. Cost Per shipment As shipment size increases, favor lower variableand higher fixed costs. shipment size