Download
1 / 1
10 likes | 125 Views
Real- time Detection of Blood Pressure changes using contact free sensors Presenting student: Efrat Herbst Instructed by: Zvika Shinar. Methods. Results. Introduction. Median ratio between max/min peak to peak amplitude:

E N D
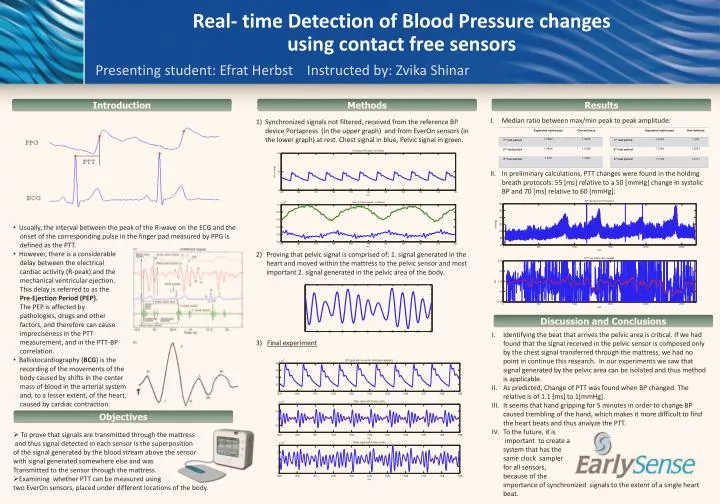
Real- time Detection of Blood Pressure changes • using contact free sensors • Presenting student: Efrat Herbst Instructed by: Zvika Shinar Methods Results Introduction Median ratio between max/min peak to peak amplitude: In preliminary calculations, PTT changes were found in the holding breath protocols: 55 [ms] relative to a 50 [mmHg] change in systolic BP and 70 [ms] relative to 60 [mmHg]: • Synchronized signals not filtered, received from the reference BP device Portapress (in the upper graph) and from EverOn sensors (in the lower graph) at rest. Chest signal in blue, Pelvic signal in green. • Proving that pelvic signal is comprised of: 1. signal generated in the heart and moved within the mattress to the pelvic sensor and most important 2. signal generated in the pelvic area of the body. • 3) Final experiment • Usually, the interval between the peak of the R-wave on the ECG and the • onset of the corresponding pulse in the finger pad measured by PPG is • defined as the PTT. • However, there is a considerable • delay between the electrical • cardiac activity (R-peak) and the • mechanical ventricular ejection. • This delay is referred to as the • Pre-Ejection Period (PEP). • The PEP is affected by • pathologies, drugs and other • factors, and therefore can cause • impreciseness in the PTT • measurement, and in the PTT-BP • correlation. • Ballistocardiography (BCG) is the • recording of the movements of the • body caused by shifts in the center • mass of blood in the arterial system • and, to a lesser extent, of the heart, • caused by cardiac contraction. Discussion and Conclusions Identifying the beat that arrives the pelvic area is critical. If we had found that the signal received in the pelvic sensor is composed only by the chest signal transferred through the mattress, we had no point in continue this research. In our experiments we saw that signal generated by the pelvic area can be isolated and thus method is applicable. As predicted, Change of PTT was found when BP changed. The relative is of 1.1 [ms] to 1[mmHg]. It seems that hand gripping for 5 minutes in order to change BP caused trembling of the hand, which makes it more difficult to find the heart beats and thus analyze the PTT. To the future, it is important to create a system that has the same clock sampler for all sensors, because of the importance of synchronized signals to the extent of a single heart beat. Objectives • To prove that signals are transmitted through the mattress • and thus signal detected in each sensor is the superposition • of the signal generated by the blood stream above the sensor • with signal generated somewhere else and was • Transmitted to the sensor through the mattress. • Examining whether PTT can be measured using • two EverOn sensors, placed under different locations of the body.