Download

1 / 22
220 likes | 325 Views
TPW Hungary. Teva’s overview 2010. Established at 1901 in Jerusalem by 3 young pharmacists…. Only To become 100 years later, the Global No. 1 in generics. 1 to 31 in 10 seconds. No. 1 generic pharmaceutical company Top 15 global pharmaceutical company

E N D
TPW Hungary Teva’s overview 2010
Only To become 100 years later, the Global No. 1 in generics
1 to 31 in 10 seconds No. 1 generic pharmaceutical company Top 15 global pharmaceutical company 53 Billion tablets manufactured in 2009 Operations in almost 60 countries Distribution of products to over 100markets Global product portfolio of more than 1,250 molecules 2,500prescriptions every minute Close to40,000 employees in Teva $13.9 billion in sales and $3 billion in non GAAP net income in 2009 Strategic goal of $31 billion in sales by 2015 * As of Dec 31st2009
Teva worldwide 2010 60 locations worldwide
Teva organizational structure President & CEO CFO Business Development Human Resources & Chief Integration Officer Chief Legal Officer Chief R&D Officer Corporate Quality Asia Global Branded Products Americas Europe EMIA Teva GenericsSystem
Teva’s global lead grew significantly 1.6 $13.9 B $7.8 B $5.1 B $1.7 B $2.8 B Sandoz Watson Ranbaxy Mylan 2009 Global Peer Group Sales $16.2 B 2X $2.3 B $2.2B $1.6 B Dr. Reddy Stada Source: Company filings and analysts’ reports
1990 2000 2009 1990 2000 2009 1990 2000 2009 1990 2000 2009 1990 2000 2009 1990 2000 2009 Strong growth track record Sales Net income Operations Plants Employees Market cap numbers Countries $bn $m Thousand $bn * 13.9 3,000 60 59 35.1 49.8 30 21 8.7 18 9.6 2.5 1.7 6 148 0.3 0.3 19 * 2009 Net income - Non-GAAP ** Employees & Market cap as of Dec 31st
Balanced business model Diversityacross: Business lines, products, geographies HighGROWTH High MARGINS 70%Generic 30%Branded
Opava, Czech Republic maximum capacity 7 bn tablets
Debrecen, Hungary Maximum packaging 10 bn tablets
Driven to Grow 2009 2015 Revenues $14 bn $31 bn Net income $3.0 bn $6.8 bn Net profit 24% 22%
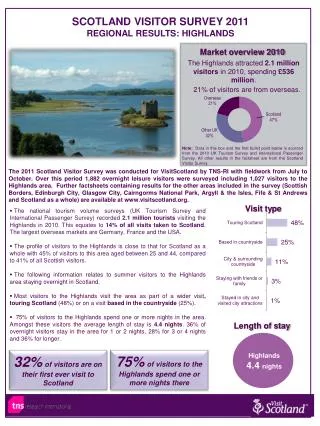
Balance in terms of geography Sales 2009 = $13.9 bn Sales 2015 = $31 bn International International 14% 22% 24% 62% 48% 30% Europe Europe North America North America
Lewandowski Ildikófőosztályvezető 2010-11-18 Controlling tevékenység A TEVA központ felé történő kommunikáció
Controlling tevékenység • Számviteli és Üzleti riportok • Tervezés • Terv-tény eltérések monitorozása, elemzése • Forecastok készítése • KPI adatszolgáltatás, elemzés
Riport típusok • Számviteli szemléletű riportok Magyar szabályok szerint készült éves beszámolók US GAAP szabályok szerint készült havi, negyedéves , éves riportok • Üzleti szemléletű riportok • Teva generic system-gyártás és GR&D • Marketing BU-ok, régiók, ország/partner • Global funkcionális szervezetek • Global integrált rendszer az Oracle • A modulok folyamatos bevezetése • A Finance már bevezetésre került Teva szinten
Riportolási rendszer Tervezési szoftver ORACLE VIR HYPERION GARP Tényriportok NASDAQ, TEVA Terv – Tény riportok TEVA Global Controlling rendszer Terv – Tény riportok Management
Controlling riportok - Global Operation • Üzemi P&L-ek • Termelési adatok • Létszám adatok • Egységköltség adatok • Technológiai költség adatok • Forecastok • Benchmarkok Gyakoriság • Havi riportok • Negyedéves riportok Riportoló eszköz • Hyperion
Tervezés • A tervezési periódus 3 év • Két irányú tervezési folyamat • Stratégia lebontása – kapacitás növelés, transzferek, kiválósági központok kialakítása • A tárgyévre vonatkozó global tervezési utasítás, amely tartalmazza az - árfolyamokat - határidőket - célkitűzéseket • Helyi szintű tervezés -cost center/főkönyvi szám -üzemi szintű P&L - Hyperion - termékszintű kalkuláció – ABC costing • - BU unit , divízió és vállalati szintű tervek • Global szoftverek – Hyperion , termékszintű adatbázis