Download
1 / 1
10 likes | 94 Views
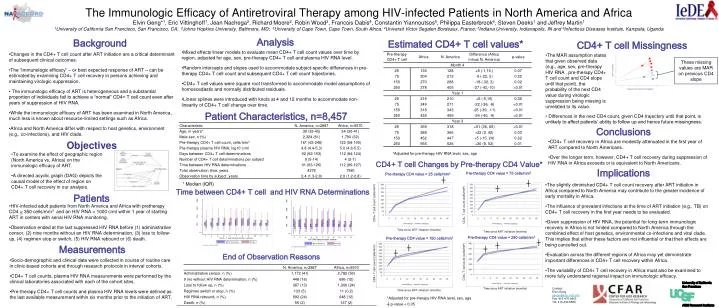
Estimated CD4+ T cell values*. Analysis. CD4+ T cell Missingness. Background. Mixed effects linear models to evaluate mean CD4+ T cell count values over time by region, adjusted for age, sex, pre-therapy CD4+ T cell and plasma HIV RNA level.

E N D
Estimated CD4+ T cell values* Analysis CD4+ T cell Missingness Background • Mixed effects linear models to evaluate mean CD4+ T cell count values over time by region, adjusted for age, sex, pre-therapy CD4+ T cell and plasma HIV RNA level. • Random intercepts and slopes used to accommodate subject-specific differences in pre-therapy CD4+ T cell count and subsequent CD4+ T cell count trajectories. • CD4+ T cell values were square root transformed to accommodate model assumptions of homoscedastic and normally distributed residuals. • Linear splines were introduced with knots at 4 and 12 months to accommodate non-linearity of CD4+ T cell change over time. • Changes in the CD4+ T cell count after ART initiation are a critical determinant of subsequent clinical outcomes. • The “immunologic efficacy” – or best expected response of ART – can be estimated by examining CD4+ T cell recovery in persons achieving and maintaining virologic suppression. • The immunologic efficacy of ART is heterogeneous and a substantial proportion of individuals fail to achieve a “normal” CD4+ T cell count even after years of suppression of HIV RNA. • While the immunologic efficacy of ART has been examined in North America, much less is known about resource-limited settings such as Africa. • Africa and North America differ with respect to host genetics, environment (e.g., co-infections), and HIV clade. • The MAR assumption states that given observed data (e.g., age, sex, pre-therapy HIV RNA , pre-therapy CD4+ T cell count and CD4 slope until that point), the probability of the next CD4 value during virologic suppression being missing is unrelated to its value. These missing values are MAR on previous CD4 slope The Immunologic Efficacy of Antiretroviral Therapy among HIV-infected Patients in North America and AfricaElvin Geng*1, Eric Vittinghoff1, Jean Nachega2, Richard Moore2, Robin Wood3, Francois Dabis4, Constantin Yiannoutsos5, Philippa Easterbrook6, Steven Deeks1 and Jeffrey Martin11University of California San Francisco, San Francisco, CA; 2Johns Hopkins University, Baltimore, MD; 3University of Cape Town, Cape Town, South Africa; 4Universit Victor Segalen Bordeaux, France; 5Indiana University, Indianapolis, IN and 6Infectious Diseases Institute, Kampala, Uganda Patient Characteristics, n=8,457 • Differences in the next CD4 count, given CD4 trajectory until that point, is unlikely to affect patients’ ability to follow up and hence future missingness. Conclusions • CD4+ T cell recovery in Africa are modestly attenuated in the first year of ART compared to North Americans. • Over the longer term, however, CD4+ T cell recovery during suppression of HIV RNA in Africa exceeds or is equivalent to North Americans. Objectives *Adjusted for pre-therapy HIV RNA level, sex, age • To examine the effect of geographic region (North America vs. Africa) on the immunologic efficacy of ART. • A directed acyclic graph (DAG) depicts the causal model of the effect of region on CD4+ T cell recovery in our analysis. CD4+ T cell Changes by Pre-therapy CD4 Value* Implications Pre-therapy CD4 value = 75 cells/mm3 Pre-therapy CD4 value = 25 cells/mm3 ┼ ┼ * Median (IQR) • The slightly diminished CD4+ T cell count recovery after ART initiation in Africa compared to North America may contribute to the greater incidence of early mortality in Africa. • The influence of prevalent infections at the time of ART initiation (e.g., TB) on CD4+ T cell recovery in the first year needs to be evaluated. • Given suppression of HIV RNA, the potential for long-term immunologic recovery in Africa is not limited compared to North America through the combined effect of host genetics, environmental co-infections and viral clade. This implies that either these factors are not influential or that their effects are being cancelled out. • Evaluation across the different regions of Africa may yet demonstrate important differences in CD4+ T cell recovery within Africa. • The variability of CD4+ T cell recovery in Africa must also be examined to more fully understand regional impact on immunologic efficacy. ┼ Time between CD4+ T cell and HIV RNA Determinations Patients CD4+ T cell count (cells/mm3) • HIV-infected adult patients from North America and Africa with pretherapy CD4 < 350 cells/mm3 and an HIV RNA < 1000 c/ml within 1 year of starting ART in centers with serial HIV RNA monitoring. • Observation ended at the last suppressed HIV RNA before (1) administrative censor, (2) nine months without an HIV RNA determination, (3) loss to follow-up, (4) regimen stop or switch, (5) HIV RNA rebound or (6) death. CD4+ T cell count (cells/mm3) Time since ART initiation (months) Time since ART initiation (months) Pre-therapy CD4 value = 250 cells/mm3 Pre-therapy CD4 value = 150 cells/mm3 ┼ Measurements ┼ ┼ ┼ End of Observation Reasons ┼ • Socio-demographic and clinical data were collected in course of routine care in clinic-based cohorts and through research protocols in interval cohorts. • CD4+ T cell counts, plasma HIV RNA measurements were performed by the clinical laboratories associated with each of the cohort sites. • Pre-therapy CD4+ T cell counts and plasma HIV RNA levels were defined as the last available measurement within six months prior to the initiation of ART. CD4+ T cell count (cells/mm3) CD4+ T cell count (cells/mm3) Time since ART initiation (months) Contact: Elvin Geng genge@php.ucsf.edu Fax: 415-476-6953 Tel: 415-430-5589 Time since ART initiation (months) *Adjusted for pre-therapy HIV RNA level, sex, age ┼ p-value < 0.05