Download
1 / 62
620 likes | 767 Views
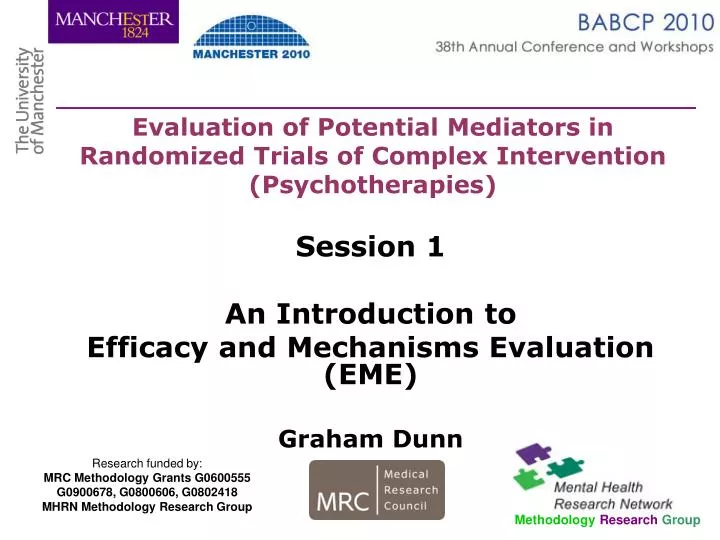
Methodology Research Group. Evaluation of Potential Mediators in Randomized Trials of Complex Intervention (Psychotherapies). Session 1 An Introduction to Efficacy and Mechanisms Evaluation (EME) Graham Dunn. Research funded by: MRC Methodology Grants G0600555

E N D
MethodologyResearch Group Evaluation of Potential Mediators in Randomized Trials of Complex Intervention (Psychotherapies) Session 1 An Introduction to Efficacy and Mechanisms Evaluation (EME) Graham Dunn Research funded by: MRC Methodology GrantsG0600555 G0900678, G0800606, G0802418 MHRN Methodology Research Group
Efficacy estimation Correlation and causality The role of random allocation Efficacy in the presence of departures from randomisation (non-compliance) Estimation via Intention-To-Treat, Per Protocol, and As Treated approaches The Complier-Average Causal Effect (CACE) CACE estimation via Principal Stratification CACE estimation via Instrumental Variable methods Mechanisms evaluation Introduction to mediation ‘Traditional’ Baron & Kenny methods to assess mediation Extending instrumental variable methods to allow for omitted variables (hidden confounding) Therapeutic alliance and treatment-effect heterogeneity Plan for this Session
A typical problem Observation: From routine clinical records, receipt of CBT (A) is correlated (associated) with better clinical outcomes (B). What can we infer? Either A causes B (the ‘nice’ explanation) or 2. B causes A (unlikely because A is the intervention) or 3. There is a common cause, C (confounding by prognostic indicators) or 4. Any combination of some or all of the above. Correlation and Causality
A Path Diagram: Receipt of treatment (CBT) Clinical outcome (BDI score, say) A B C Confounders: factors that influence both selection for treatment and outcome
The Role of Random Allocation Receipt of treatment (CBT) Clinical outcome (BDI score, say) A B Path blocked C No confounding: Correlation now implies a treatment effect
Efficacy Estimation We have carried out a randomized controlled trial (RCT) for the treatment of depression: Treatment As Usual (TAU) – Control versus TAU plus Cognitive Behaviour Therapy (CBT) Everyone in the CBT arm receives the allocated treatment (and none in the Control arm). Everyone in the trial provides a measure of outcome (a BDI score). Efficacy is estimated by comparing the average BDI in the CBT arm with the average BDI in the controls. It is the effect of receivingtreatment.
Efficacy Estimation Now let the randomised trial be a bit more realistic! Let’s assume that a fairly large proportion (30-50%, say) of those allocated to the CBT arm do not turn up for their therapy. We still have an outcome measurement (BDI score) for everyone. Comparison of average outcomes for participants as randomised (the Intention-To-Treat or ITT estimate) now provides us with an estimate of the effect of offering treatment (it is a measure of the Effectiveness of the treatment offer). It’s a very sensible thing to do, but what about treatment efficacy? What’s the effect of getting the treatment?
Efficacy Estimation The Per Protocol (PP) estimate compares the average outcome in the Controls with the average outcome of those in the CBT arm who adhered to the protocol (i.e. received treatment). Based on an implicit assumption that the treatment compliers are comparable to those excluded participants who did not adhere to their allocated treatment. However, this is very unlikely to be true – and the PP estimate will be subject to selection effects/confounding (i.e. biased). The As Treated (or On Treatment) estimate ignores randomisation and compares the average outcome in the participants who received treatment with the average of those who did not. Again, very likely to be biased (subject to selection effects/confounding).
Efficacy Estimation The Complier-Average Causal Effect (CACE) estimate is the comparison of the average outcome of the compliers in the CBT arm with the average outcome of the comparable group of would-be compliers* in the Control arm. * Those people in the Control group who would have complied with their treatment allocation had they, contrary to fact, been allocated to receive CBT. This is a randomisation-respecting estimate. It is the ITT effect in the sub-group of participants who would always comply with their treatment allocation. It is not subject to confounding But how is it calculated? First, we make some explicit assumptions.
Efficacy (CACE) Estimation Assumptions 1. There are two latent classes of participants (Principal Strata): Compliers and Non-compliers. Compliers get therapy ifand only if allocated to the treatment. Non-compliers never get the therapy, Regardless of allocation. 2. As a consequence of randomisation, on average, the proportion of Compliers is the same in the two arms of the trial. 3. In the absence of treatment (i.e. for the Non-compliers) there is no effect of randomisation (i.e. treatment arm) on outcome. This assumption is often called an exclusion restriction.
Example: The ODIN trial • Trial of 2 psychological interventions to reduce depression (Dowrick et al, 2000) • Randomised individuals: • 236 to the psychological interventions (E) • 128 to treatment as usual (S) • Outcome: Beck Depression Inventory (BDI) at 6 months • recorded on 317 randomised individuals
complier-average causal effect (CACE) randomisation balance (59*140/177) 46.7 13.22 93.316.13 exclusion restriction CACE analysis (2) Note: 66.7% compliance (118/177)ITT / 0.667 = CACE CACE = 13.32 – 16.13 = -2.81(cf ITT = 13.29 – 15.16 = -1.87)
CACE Estimation CACE estimate = ITT estimate for outcome ITT estimate for treatment received = ITT estimate for outcome Proportion of Compliers = -1.87/0.667 = -2.81
CACE equal PP equal CACE is based on the “exclusion restriction” assumption Per-protocol analysis estimates the CACE under the “random non-compliance” assumption CACE vs. PP
Instrumental Variables We wish to estimate the effect of treatment received on outcome. We suspect that treatment received and outcome are confounded (i.e. there are omitted variables that both influence treatment receipt and outcome). If we can assume that • randomisation (treatment allocation) has an effect on outcome but, only through its effect on treatment receipt, and 2. randomisation is independent of all confounders, then randomisation is an instrumental variable or instrument (IV) and instrumental variable estimation will solve the problem.
Instrumental Variables Completemediation of the effect of treatment allocation by treatment receipt. Outcome (BDI) Treatment Received (CBT) Randomised Allocation (rgroup) Omitted variables (Confounders)
Instrumental Variable (IV) Regression Most general packages contain instrumental variable (two stage least squares or 2SLS) routines. These include SPSS, SAS and Stata. Here, we will illustrate their use through the ivregress command in Stata Version 11: ivregress 2sls BDI (CBT=rgroup)
Efficacy (CACE) Estimation (IV regression) ivregress 2sls bdi6 (complya = rgroup) Instrumental variables (2SLS) regression Number of obs = 317 Wald chi2(1) = 2.66 Prob > chi2 = 0.1029 R-squared = . Root MSE = 10.13 ------------------------------------------------------------------------------ bdi6 | Coef. Std. Err. z P>|z| [95% Conf. Interval] -------------+---------------------------------------------------------------- complya | -2.803511 1.718695 -1.63 0.103 -6.172091 .5650694 _cons | 15.15714 .856179 17.70 0.000 13.47906 16.83522 ------------------------------------------------------------------------------ Instrumented: complya Instruments: rgroup CACE estimate -2.80 (s.e. 1.72)
Missing Outcome Data (loss to follow-up) • Loss to follow-up strongly related to non-compliance with allocated treatment. • Possible to extend estimation procedures to allow for a credible missing data mechanism: • Missing data jointly determined by allocation, baseline covariates, treatment received (Missing at Random or MAR) or • Missing data jointly determined by allocation and the latent would-be compliance status (Latently Ignorable or LI).
128 108 236 complier-average causal effect (CACE) randomisation balance (108*191/236) 103.6 87.4 191 13.22 93.316.13 exclusion restriction 16.80 CACE analysis under MAR(Outcome data Missing At Random) CACE (MAR) = 13.32 – 16.80 = -3.48cf CACE (CC) = 13.32 – 16.13 = -2.81
Mechanisms Evaluation Compliance with allocated treatment Does the participant turn up for any therapy? How many sessions does she attend? Fidelity of therapy How close is the therapy to that described in the treatment manual? Is it a cognitive-behavioural intervention, for example, or merely emotional support? Quality of the therapeutic relationship What is the strength of the therapeutic alliance? Is it associated with the effect of treatment?
Mechanisms Evaluation What is the concomitant medication? Does psychotherapy improve compliance with medication which, in turn, leads to better outcome? What is the direct effect of psychotherapy? Is there any? What is the concomitant substance abuse? Does psychotherapy reduce cannabis use, which in turn leads to improvements in psychotic symptoms? What are the participant’s beliefs? Does psychotherapy change attributions (beliefs), which, in turn, lead to better outcome? How much of the treatment effect is explained by changes in attributions?
Mechanisms Evaluation Treatment Effect Mediation Depressed Mood CBT γ β α Change in Medication Omitted variables (Confounders)
The Mediation Industry Baron RM & Kenny DA (1986). The moderator-mediator variable distinction in social psychological research: conceptual, strategic, and statistical considerations. Journal of Personality and Social Psychology51, 1173- 1182. February 2010:Over 13,000 citations – 2000 over the last year alone! Depends on the implicitly-assumed absence of hidden confounding(non-ignorable selection). The Assumptions are veryrarely stated, let alone their validity discussed. One suspects that the majority of investigators are obliviousof the assumptions and of their implications. Results are of unknown and questionable value.
The Mediation Literature It’s unfortunate that the 1986 paper by Baron & Kenny has been so influential. They were fully aware of the omitted variables problem, as is shown by reference to an earlier (much better) paper: Judd, C. M. and Kenny, D. A. (1981). Process analysis: Estimating mediation in treatment evaluations. Evaluation Review 5, 602– 619. They just didn’t think to mention it! David Kenny himself admits that this is problematic (see his Mediation website), but the paper now has a life of its own!
The Baron & Kenny approach • Evaluate the effect of therapy on outcome ITT – OK, no confounding 2. Evaluate effect of therapy on potential mediator ITT – OK, no confounding 3. Evaluate effect of mediator on outcome, and of therapy on outcome, conditioning on mediator. Only valid ifthere is no confounding (i.e. no omitted variables)*. * The problem is not solved by replacing multiple regression by structural equation models (sem).
The Baron & Kenny model: Depressed Mood CBT γ α β Change in Medication There are no omitted variables. Is this realistic? No Way!
The Solution? • Design: Try to think of and measure all of the potential confounders. Make sure there are no omitted variables to worry about. In addition, build in convincing instrumental variables. • Analysis: Extend instrumental variable, principal stratification and other models to allow for missing confounding. Need to find additional instrumental variables. These methods depend on alternative assumptions. Are the necessary assumptions realistic? • Cast doubt on your results: Perhaps it’s not realistic to think we’ve got the right model, but to try several and check whether the results are dependent on the assumptions that we need. i.e. carry out a thorough Sensitivity Analyses.
Mechanisms Evaluation: IV Models Treatment Centre by CBT interaction CBT (Random) Use centre differences (or trial differences) as Instrumental Variables (IVs) Beliefs Psychotic symptoms Treatment Centre C
Mediation – the PROSPECT trial Results from the analysis of a US suicide prevention trial (PROSPECT) – psychotherapy for depression in the elderly. The therapy influenced compliance with antidepressant medication. Did this explain the results? – from Table 4 of Emsley, Dunn & White, 2010 ITT effect: −3.15 (0.82) Analytical method Direct effect, γ(s.e.) Indirect effect, β(s.e.) Regression (B&K) −2.66 (0.93) −1.24 (1.09) IV (ivregress) −2.38 (1.35) −1.95 (2.71) Principal stratification (with monotonicity) −2.62 (1.38)* −1.37 (2.97)* *Bootstrap standard errors.
Treatment-effect Modification • Treatment effects vary from one individual to another - i.e. there is treatment-effect heterogeneity. • Treatment effects may be influenced by baseline (pre-randomisation) covariates such as gender, age, prior history of illness, personality, insight, treatment centre, and so on. This source of treatment effect heterogeneity is called treatment-effect moderation. [Aside: this is an essential component of the evaluation of treatment mediation as described above] • Treatment effects may be influenced by therapist characteristics (Chris’ session this afternoon). • Perhaps the most interesting source of treatment-effect heterogeneity are process measures such as the therapeutic alliance (another potential mediator).
Role of the Therapeutic Alliance • An RCT: CBT versus controls (no therapy) • The therapeutic alliance can only be measured in people who receive CBT (but let’s assume we have 100% adherence to allocated treatment) • Alliance scores are subject to measurement errors (as are measurements of most mediators, for that matter!) • The effect of alliance on outcome is highly likely to be subject to confounding (a patient capable of forming a strong therapeutic alliance is also likely to have the better outcome, even in the absence of therapy).
Evaluating the effects of the Therapeutic Alliance: A typical analysis strategy • Ignore the control group and anyone else who has not received treatment • Look at the correlation between alliance score and outcome (BDI score, for example) • Infer that this correlation (if found) tells us something reliable about the relationship between the strength of the therapeutic alliance and the effect of therapy. • This analysis is flawed! These data cannot be used to distinguish treatment effects from treatment-free prognosis.
Evaluating the effects of Alliance: What are we trying to evaluate? The treatment-effect on an a particular individual is the difference between the outcome after treatment and the outcome after experiencing the control condition. We cannot observed individual treatment effects, but we can use outcome means, together with randomisation of treament, to estimate average treatment effects. For simplicity, let’s make alliance binary: strong versus weak.
Principal Strata defined by Alliance Two strata: Strong: Strong alliance if allocated to receive CBT, not recorded (latent) otherwise. Weak: Weak alliance if allocated to receive CBT, unrecorded (latent) otherwise. The proportion of participants in the strong alliance stratum is, on average, the same in the treated and control groups (c.f. CACE estimation). Stratum membership is independent of treatment allocation (no confounding). We would like to compare the effect of randomisation (i.e. the ITT effect) in these two strata. It is this that would provide us with evidence of treatment-effect heterogeneity.
Analysis of Treatment-effect heterogeneity • Unlike CACE estimation, we cannot assume that there is no effect of allocation in one of the groups (i.e. the exclusion restriction is unlikely to be valid). • In order to proceed we need strong baseline predictors of stratum membership or, in the general case, strong predictors of potential strength of the therapeutic alliance. • Statistical methods used involve extensions of CACE analysis or IV estimation (as in the evaluation of mediation).
An Example: The SoCRATES Trial • SoCRATES was a multi-centre RCT designed to evaluate the effects of cognitive behaviour therapy (CBT) and supportive counselling(SC) on the outcomes of an early episode of schizophrenia. • Participants were allocated to one of three conditions: Treatment as Usual (TAU), CBT + TAU, SC + TAU. • For our illustrative purposes, we ignore the distinction between CBT and SC, using a binary variable to distinguish treatment and control. • The explanations will involve repetition of some of the stuff I’ve already covered above. I hope it helps!
SoCRATES(contd.) • 3 treatment centres: Liverpool, Manchester and Nottinghamshire. Other baseline covariates include logarithm of untreated psychosis and years of education. • Outcome (a psychotic symptoms score) was obtained using the Positive and Negative Syndromes Schedule (PANSS). We consider the 18 month PANSS total score here. • From an ITT analyses of 18 month follow-up data, both psychological treatment groups had a superior outcome in terms of symptoms (as measured using the PANSS) compared to the control group. There were no differences in the effects of CBT and SC, but there was a strong centre effect, with outcomes for the psychological therapies at one of the centres (Liverpool) being significantly better than at the remaining two.
SoCRATES (contd.) • Post-randomization variables that have a potential explanatory role in exploring the therapeutic effects include the total number of sessions of therapy actually attended and the quality or strength of the therapeutic alliance. • Therapeutic alliance was measured at the 4th session of therapy, early in the time-course of the intervention, but not too early to assess the development of the relationship between therapist and patient. We use a patient rating of alliance based on the CALPAS (California Therapeutic Alliance Scale). • Total CALPAS scores (ranging from 0, indicating low alliance, to 7, indicating high alliance) were used in some of the analyses reported below, but we also use a binary alliance variable (1 if CALPAS score ≥5, otherwise 0). .
SoCRATES (contd.) • 182 (88.3%) out of 206 patients in the treated groups provided data on the number of sessions attended. 56 patients from the CBT group and 58 from the SC group completed CALPAS forms at session 4 (overall 55.34%). • The analysis presented here is based on all control participants but only those from treated groups who provide both a CALPAS and a record of the number of sessions (missing sessions/alliance data another potential source of bias that will be ignored here).
SoCRATES “dose”-response model: complete mediation (direct effect assumed to be absent) Offer of Treatment (random) Sessions Attended Psychotic Symptoms U What’s the role of the therapeutic alliance? Does Alliance modify the effect of randomisation on sessions attended? Does Alliance modify the effect of treatment received on outcome?
Does the quantity (sessions) and quality (alliance) of the therapy influence the treatment effect? • Does the contrast between the treatment outcome and the counterfactual treatment-free outcome increase with the number of sessions attended? • Does the contrast between the treatment outcome and the counterfactual treatment-free outcome increase with increasing alliance? • Is there an interaction between sessions and alliance?
Randomisation-respecting inference • Estimate effects of post-randomisation variables that involve the comparison of randomised sub-groups of patients (within-class Intention-to-Treat or ITT effects). • For example, we compare (or would like to compare) the outcome of treatment in those participants who develop a given level of alliance with the outcome in the control patients who would have developed the same level of alliance if they had been allocated to receive therapy.
The identification problem • Our model is not identified (i.e. our data are not rich enough to allow us to estimate the parameters of interest) • We need to be able to find variables which influence sessions and alliance but have no direct effect on outcome (instrumental variables). • We needmultiple instruments.
Multiple IVsWhere do we get them from? • Randomisation involving more than one active treatment – i.e. to interventions specifically targeted at particular intermediate variables. • Randomisation-by-baseline variable interactions - Randomisation-by-Centre, for example. • Randomisation-by-trial (multiple trials). • Genetic markers (Mendelian Randomisation) used together with randomisation – not relevant to most psychotherapy trials but could be very useful if used in conjunction with randomisation in pharmacotherapy research.
Estimation • SMM / G-estimation (not discussed here) • IV regression - Two-Stage Least Squares (2SLS) ivregress 2sls panss i.centre (s as = i.centre*rgroup) • ML using structural equation modelling software (easier to cope with missing outcome models)