Download
1 / 19
190 likes | 196 Views
Research: Pan-European Criteria and Indicators for Sustainable Forest Management. Case Study Liechtenstein (2003). Future Perspectives (Discussion). Pan-European Criteria and Indicators for Sustainable Forest Management. C&I catalogue. 6 Criteria (Helsinki-Criteria). qualitative Indicators.

E N D
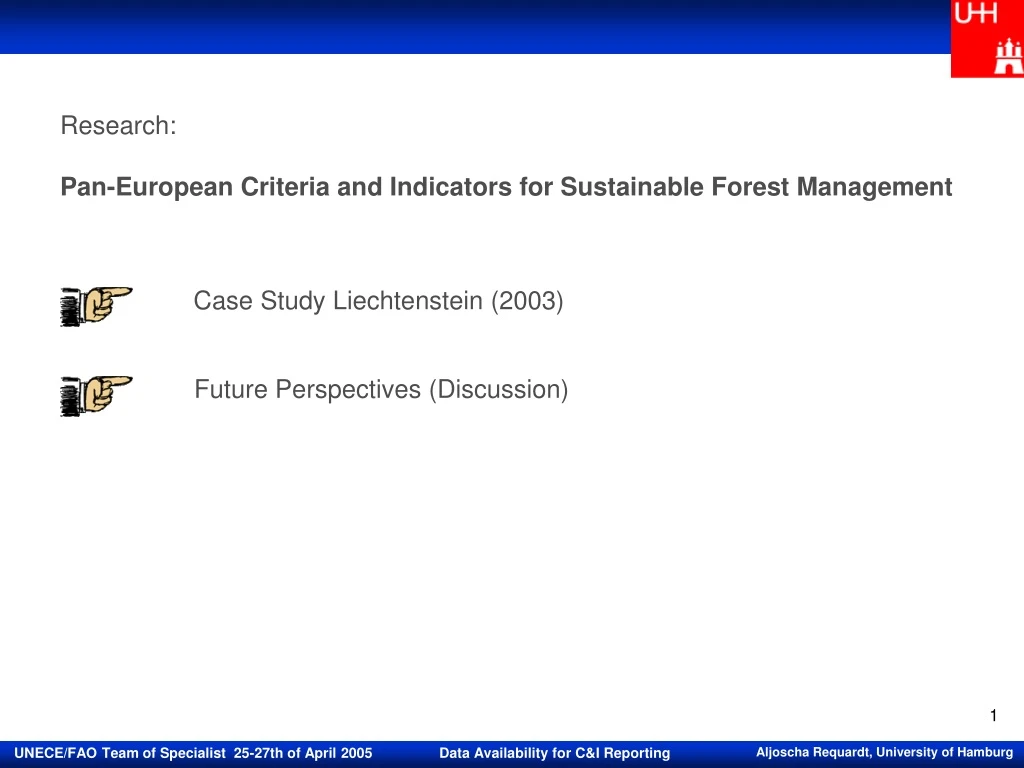
Research: Pan-European Criteria and Indicators for Sustainable Forest Management Case Study Liechtenstein (2003) Future Perspectives (Discussion)
Pan-European Criteria and Indicators for Sustainable Forest Management C&I catalogue 6 Criteria (Helsinki-Criteria) qualitative Indicators 35 quantitative Indicators Indicator specified classifications / attributes status and changes
Case Study Liechtenstein - Objectives Which of the required information and data of the 35 quantitative indicators, both in quantity as well as in quality, can be supplied by the current information system of Liechtenstein and how can available data be compiled in a simple but comprehensive data report? This requires an analysis and evaluation of the current data availability and data potential as well as the derivation of an C&I data report. C&I
Methodology Type I: given data potential • DM/A :basis-data and methodology are given – • data interpretation and data analysis in required form • DM/B :basis-data and methodology are given – • data interpretation and data analysis in other form • DM/C :basis-data and methodology are given – • no available data interpretation and data analysis • Dm : basis-data are given, but methodology is not • dM : basis-data are not given, but methodology is Analysis of Data-Availability and Data-Potential Type II: no data potential • dm : both basis-data and methodology are not given
Results Data-Report - Data-Availability and Data-Potential All 35 (36) indicators were studied and analysed 34 indicators were included in the final evaluation In total 194 classifying attributes were tested and evaluated C1 = 32 C2 = 16 C3 = 20 C4 = 48 C5 = 8 C6 = 70
Results Data-Report - Data-Availability and Data-Potential All 35 (36) indicators were studied and analysed 34 indicators were included in the final evaluation In total 194 classifying attributes were tested and evaluated C1 = 32 C2 = 16 C3 = 20 C4 = 48 C5 = 8 C6 = 70
Results Data-Report Indicators with very limited or even no data potential (Examples) Indicator 1.4 „Carbon stock“ Indicator 2.2 „Soil condition“ Indicator 3.3 „Services“ Indicator 4.7 „Landscape pattern“ Indicator 5.1 „Protective forests – soil, water and ecosystem functions“ Indicator 6.4 „Total expenditures for services from forestry“ Indicator 6.8 “Trade in Wood” • also problematic: • classified by forest type • classified by availability of wood supply
Results Data-Report - Source, Temporal and Spatial Analysis and Evaluation
Results Data-Report - Source, Temporal and Spatial Analysis and Evaluation
Secondary Results – Data Report • due to different data sources or even non compatible data within one data source • – data statement not always clear • current data availability could be enormously improved by an optimised • saturation of the theoretical data availability • problem: Total Forest Area (3 data sources = 3 figures) • changes of NFI 1986 to NFI 1998 rely on a different spatial resolution • than the data of NFI 1998 • Status data: 5080 ha • Changes data: 4259 ha • Indicator-set: further improvements and research necessary • Indicator 6.4 „Total expenditures for services from forests“ • Indicator 6.11 „Cultural and spiritual values“
Secondary Results – Data Report Problem: Total Forest Area (3 data sources = 3 figures) ?
Case Study Liechtenstein It has been shown: • how the operability and applicability of the pan-European indicators and their meaning as a reporting tool in the case of Liechtenstein could be assessed • how the situation of data availability and data potential for an adequate C&I reporting could look like • that the deficits between demand and supply of relevant information are impressive and that the reason for that are various C&I
Future Perspectives Surely the results can not be directly compared to other national data situation in other countries, but it can be assumed that the relation between international demand and national supply shows same tendencies and obstacles like in Liechtenstein. In how far can the required information of the pan-European Criteria and Indicators be supplied and reported by the members of the pan-European SFM process either in short- or long term? ? C&I
Future Perspectives: Politics and Research • Harmonisation and Streamlining • of definitions • (Expert Meeting on Harmonizing Forest related Definitions for Use by Various • Stakeholders I, II, III) • of data assessment and monitoring systems, e.g. of National Forest Inventories • (ENFINCOST Action E 43)) • forest-related reporting to international process • (e.g.: CPF Task Force on Streamlining Forest-Related Reporting)
Future Perspectives: Politics and Research further National Case Studies analysis and evaluation of data availability and data potentials analysis and evaluation of Networking Structures concerning information flows and information patterns on European level (using synergies and minimising double reporting) development and implementation of International Forest Information Systems (e.g. EU-Project NEFIS) development and implementation of “Conversion Toolkits“ within systems of data processing and data reporting improving the use and integration of new data assessment techniques as Remote Sensing
Remote Sensing – a neutral source C 1: Indicator 1.1: Forest area Indicator 1.2: Growing stock Indicator 1.4: Carbon stock C 2: Indicator 2.3: Defoliation Indicator 2.4: Forest damage C 4: Indicator 4.7: Landscape Pattern for 6 Indicators remote sensing applicable for 9 Indicators slightly or indirect applicable
Future Perspectives: Politics and Research further National Case Studies analysis and evaluation of data availability and data potentials Promote and Support National Case Studies Motivate instead De-motivate Highlight Benefits: As C&I covers a wide range of information, C&I can be considered as a perfect orientation strand to analyse and evaluate the data situation and information management on national level and European level ! Provide Assistance: Guidelines/ Expert Consultation