Download
1 / 24
240 likes | 247 Views
This study simulates wind velocity and temperature profiles in the Atmospheric Boundary Layer (ABL) using the CBL model YORCON. The modeled ABL parameters are compared with measured turbulent characteristics from experimental data in Sofia. The YORCON model accurately describes the PBL characteristics, including wind and temperature profiles, turbulent exchange coefficient, and CBL thickness.

E N D
Comparison of the CBL model YORCON with experimental and climate data from Sofia Maria Kolarova, Dimiter Yordanov(*), Nedjalko Valkov and Dimiter Syrakov National Institute of Meteorology and Hydrology (*)Geophysical Institute, Bulgarian Academy of Sciences Sofia, BULGARIA
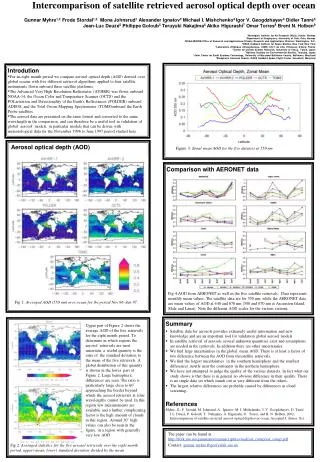
The aim of the present work is to simulate the vertical profiles of wind velocity and temperature in the Atmospheric Boundary Layer using radio-sounding data from Sofia and applying the CBL model YORCON, as well as to compare the modeled with measured turbulent characteristics of the ABL using Sofia experimental data (September-October 2003).
The CBL model YORCON (“top-down” approach) is applied to simulate the ABL parameters during experimental campaigns in Sofia. The model input data were prepared by expert and automatic processing of the wind and temperature profiles from regular radio-soundings. Simulations of the data from the experimental campaign in Sofia, September-October 2003 (Batchvarova et al., 2004) are discussed. The ABL profiles and the CBL height are modeled for chosen periods with convective conditions and compared with experimental data. The results from “modeled-measured” comparison for surface heat flux, friction velocity and the evolution of CBL height are discussed.
THE CONVECTIVE P B L MODEL YORCON A theoretical model of convective planetary boundary layer (YORCON) is developed based on the similarity theory. The model describes realistically the basic characteristics of the PBL - wind and temperature profiles, vertical turbulent exchange coefficient, CBL thickness and its variation with time. YORCON model consists of two layers - surface layer (SL) and Ekman layer over it, in which the turbulent exchange coefficient is assumed constant with height.
THE CONVECTIVE P B L MODEL YORCON An appropriate parameterization of the PBL under convective conditions is proposed on the basis of which the turbulent surface heat and momentum fluxes are estimated using generalised similarity theory. The resistance and heat exchange laws giving the relations between the external and internal to PBL parameters are numerically solved in this case. Diurnal growth of convective boundary layer (CBL) capped by an inversion is simulated on the basis of the equation governing the time changes of the inversion height.
Data from the urban boundary layer experiment (Sept./October 2003) in Sofia, that comprised high resolution radio soundings (performed with Vaisala equipment of NIMH) to determine the mixing height and mixed layer growth in a sub-urban area of the city of Sofia are used for the simulations. For the measurements of the turbulent parameters the data collected on the research tower of NIMH using two sonic anemometers and a fast hygrometer at 20 and 40m height(above ground level) were used (Batchvarova., 2004). Five days with typical convective conditions were chosen from the experimental campaign when 7 soundings per day were performed providing data for the growth of the mixed layer with 2 hours time interval. Results for three of them (29 September 1 and 2 October) are presented.
Simulations with the CBL model YORCON Radiosounding data from the experimental campaign in Sofia (28 Sept.- 3 Oct., 2003) at 6, 8, 10 12, and 14 LT were used for the simulations with the YORCON model. Input data (representative for the day) were prepared based on the sounding after sunrise for the simulation of the time evolution of convective BL height. The geostrophic wind (Vg), the potential temperature gradient above the inversion layer - Γ, gamma-extrapolated surface temperature - гe, the initial surface temperature at sun rise (θsi) and the maximum of the surface temperature (θsmax) were estimated from the experimental data and used as input data for the model YORCON.
The CBL model YORCON Two cases were modelled: a) the ground level temperature s varies sinusoidal with prescribed amplitude (sinT) b) the function surfT is used according to the real temperature measured every hour at 2 m The hour of the sun rise and the hour of the (θsmax) are prescribed as well as the time difference in hours (6 or 7 usually) - an input parameter needed for time integration.
Simulation of the ABL profiles based on radio-sounding data from Sofia and comparison with experimental data The simulations with YORCON calculate hourly evolution of daily mixed layer height (MH), surface momentum and heat fluxes and from them the profiles of wind velocity and potential temperature. The modeled daily evolution of the potential temperature and CBL height are compared with the experimental data. The measured surface kinematic heat and momentum fluxes are compared with the YORCON simulations for the surface heat flux and friction velocity and the results are shown on next figures.
Sofia, Sept. 28, 2003 a) b) a) b) Examples of wind velocity (v [m]) and potential temperature ( [degC]) profiles from two consequent radio-soundings at 8GMT and 10GMT, Sofia experiment - Sept. 28, 2003.
Sofia experiment –Sept. 28 2003, YORCON simulations Γ =0.007,Γe=13oC, Tsi=13oC, Tsmax=27oC, s.r.=7:00, tmax-tmin=7:00 Fig. 1a Simulated potential temperature vertical profile daily evolution -T(z) [deg C} Fig. 1b modeled and determined from the soundings mixed layer height
Sofia, Sept. 28, 2003 a) b) c) Comparison between modeled (at different hours) and measured at noon vertical profiles of: a) wind [m/s] ; b) potential temperature [deg C]; c) time evolution of surface potential temperature (surfT), Sofia Sept. 28, 2003.
Sofia experiment – Sept.28 2003, YORCON simulations Γ =0.007,Γe=13oC, Tsi=13oC, Tsmax=27oC, s.r.=7:00, tmax-tmin=7:00 Comparison between measured at 20m and 40mand modeled surface heat flux.
Sofia experiment – Sept.28 2003, YORCON simulations Γ =0.007,Γe=13oC, Tsi=13oC, Tsmax=27oC, s.r.=7:00, tmax-tmin=7:00 Comparison between measured at 20m and 40m and modeled friction velocity.
Sofia,October1,2003 a) b) a) b) Examples of wind velocity (v [m]) and potential temperature ( [degC]) profiles from two consequent radio-soundings at 6GMT and 10GMT, Sofia experiment October 1, 2003.
Sofia experiment –October 1 2003, YORCON simulations Γ =0.0045, Γe=15oC, Tsi=16oC, Tsmax=26oC, s.r.=6:00, tmax-tmin=7:00 Fig. 2a Simulated potential temperature vertical profile daily evolution -T(z)[degC] Fig. 2b Modeled and determined from the soundings mixed layer height
Sofia, Oct. 1, 2003 a) b) c) Comparison between modeled (at different hours) and measured at noon vertical profiles of: a) wind [m/s] ; b) potential temperature [deg C]; c) time evolution of surface potential temperature, Sofia experiment Oct. 1, 2003.
Sofia experiment – YORCON simulations Γ =0.0045,Γe=15oC, Tsi=16oC, Tsmax=26oC, s.r.=6:00, tmax-tmin=7:00 Comparison between measured at 20m and 40mand modeled surface heat flux.
Sofia experiment – YORCON simulations Γ =0.0045,Γe=15oC, Tsi=16oC, Tsmax=26oC, s.r.=6:00, tmax-tmin=7:00 Comparison between measured at 20m and 40mand modeled friction velocity.
Sofia, October 2, 2003 a) b) c) Comparison between modeled (at different hours) and measured at noon vertical profiles of: a) wind [m/s] ; b) potential temperature [deg C]; c) time evolution of surface potential temperature, Sofia experiment Oct. 2, 2003.
Comparison between MH (above sea level) determined by Richardson method and a realization of the CBL model Yorcon). On x-axis – simulated period July-Sept. 2001 and 2002; on y-axis – height above sea level in meters.
CONCLUSIONS • Applying data from the radio-soundings we can successfully investigate the daily Convective Boundary Layer, its structure, as well as the evolution of the daily mixed layer. • The CBL model YORCON simulates reasonably well the basic ABL characteristics under convective conditions as the surface turbulent fluxes for heat and momentum, the velocity and temperature profiles in ABL. • The comparisons between the modelled and measured turbulent fluxes during the Sofia experiment 2003 show good agreement with relative errors varying from 20 to 50%.
REFERENCES Yordanov, D., M. Kolarova, et al., (1990) Convective boundary layer-theory and experiment. Proc. of the 9th Symp. On Turbulence and Diffusion, RISO, Denmark, April 1990. Yordanov, D., D. Syrakov, and M. Kolarova, (1997) On the parametrization of the PBL of the atmosphere,, EURASAP Workshop Proc., 1-3 Oct. 1997, RISO, Roskilde, Denmark, S.-E. Gryning, F. Beyrich, E. Batchvarova (eds.), Riso-R-997(EN), pp. 117-120. Yordanov, D., M. Kolarova, and D. Syrakov, (2003b) Parameterisation of convective PBL using surface data for the wind and stability classes, Int. J. Env. Pollut., 20, 1-6, pp. 165-176. Yordanov, D., M. Kolarova and D. Syrakov, (2004) The ABL models YORDAN and YORCON –top-down and bottom-up approach for air pollution applications, Proc. of NATO ARW “Advances in Air Pollution Modeling for Environmental Security”, 8–12 May 2004, Borovetz, Bulgaria. Batchvarova, E., Gryning, S.-E., Rotach, M.W. and Christen, A., 2004: Modelled aggregated turbulent fluxes compared to urban turbulence measurements at different heights, in P.Supan (Ed.), Proc. of the Ninth Intern. Conf. on Harmonization within Dispersion Modelling for Regulatory Purposes, 1-4 June 2004, Garmisch-Partenkirchen, Germany, Vol. 2, pp. 7-11.