Download
1 / 31
310 likes | 316 Views
Proteoma. Milk, a source of nourishment for all mammals, is composed, in part, of a variety of proteins. The protein components of milk are revealed by the technique of MALDI-TOF mass spectrometry, which separates molecules on the basis of their mass to charge ratio. OD 340nm.

E N D
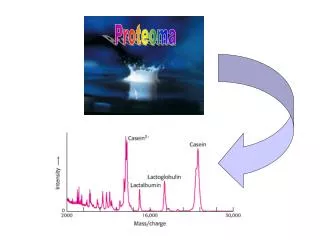
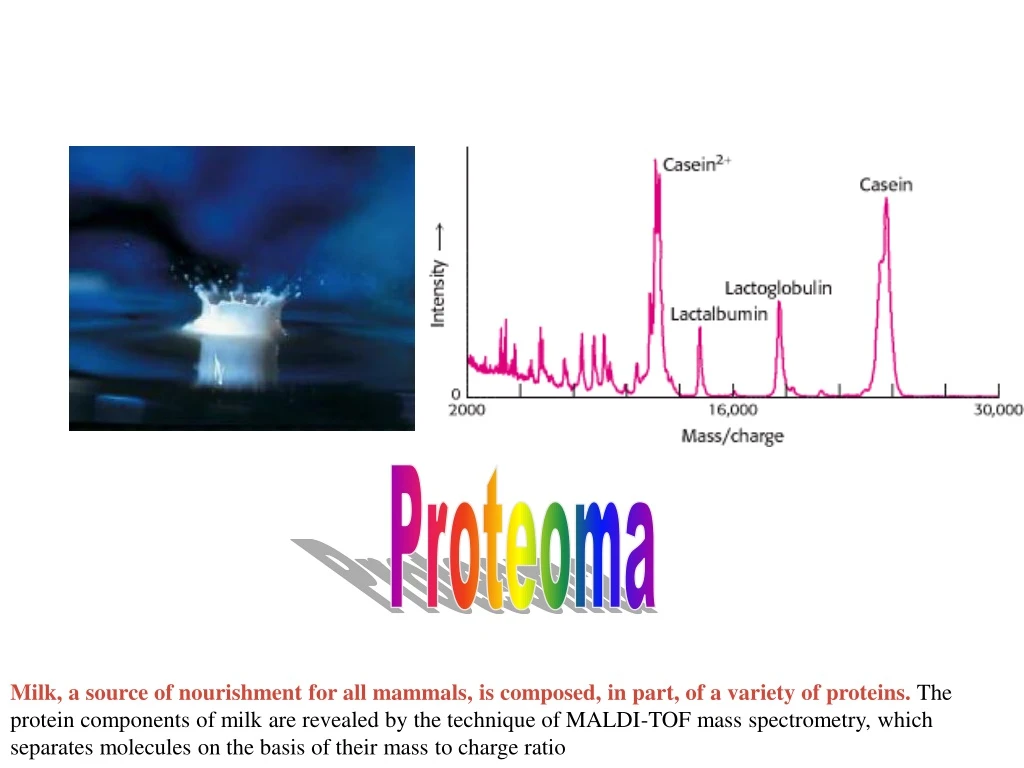
Proteoma Milk, a source of nourishment for all mammals, is composed, in part, of a variety of proteins. The protein components of milk are revealed by the technique of MALDI-TOF mass spectrometry, which separates molecules on the basis of their mass to charge ratio
OD 340nm Atividade – auxiliar na purificação (aumento OD340 por min de reação) Atividade específica: – Unidades por miligrama de proteína
Liberar a proteína da célula para purificá-la Figure 4.1. Differential Centrifugation. Cells are disrupted in a homogenizer and the resulting mixture, called the homogenate, is centrifuged in a step-by-step fashion of increasing centrifugal force. The denser material will form a pellet at lower centrifugal force than will the less-dense material. The isolated fractions can be used for further purification.
Salting out: Insolubilidade em faixas de concentração de sal precipitador (sulfato de amônio)
Diálise: Remover sal, e outros componentes de baixo PM Figure 4.2. Dialysis. Protein molecules (red) are retained within the dialysis bag, whereas small molecules (blue) diffuse into the surrounding medium.
Filtração em gel (cromatografia) – mais discriminação por faixa de PM Figure 4.3. Gel Filtration Chromatography. A mixture of proteins in a small volume is applied to a column filled with porous beads. Because large proteins cannot enter the internal volume of the beads, they emerge sooner than do small ones
Carga diferente? (histonas ++++) Figure 4.4. Ion-Exchange Chromatography. This technique separates proteins mainly according to their net charge
Figure 4.5. Affinity Chromatography. Affinity chromatography of concanavalin A (shown in yellow) on a solid support containing covalently attached glucose residues (G). Material finamente dividido = Mais sítios de interação Tempo maior de purificação... Solução = High-Pressure Liquid Chromatography! (HPLC)
EXEMPLO de HPLC Figure 4.6. High-Pressure Liquid Chromatography (HPLC). Gel filtration by HPLC clearly defines the individual proteins because of its greater resolving power: (1) thyroglobulin (669 kd), (2) catalase (232 kd), (3) bovine serum albumin (67 kd), (4) ovalbumin (43 kd), and (5) ribonuclease (13.4 kd).
Passo n° 1 do gel bi-dimensional = focalisação isoelétrica (separação por pI: ponto isoelétrico onde carga = 0) Figure 4.11. The Principle of Isoelectric Focusing. A pH gradient is established in a gel before loading the sample. (A) The sample is loaded and voltage is applied. The proteins will migrate to their isoelectric pH, the location at which they have no net charge. (B) The proteins form bands that can be excised and used for further experimentation.
GEL 2D Figure 4.12. Two-Dimensional Gel Electrophoresis. (A) A protein sample is initially fractionated in one dimension by isoelectric focusing as described in Figure 4.11. The isoelectric focusing gel is then attached to an SDS-polyacrylamide gel, and electrophoresis is performed in the second dimension, perpendicular to the original separation. Proteins with the same pI are now separated on the basis of mass. (B) Proteins from E. coli were separated by two-dimensional gel electrophoresis, resolving more than a thousand different proteins. The proteins were first separated according to their isoelectric pH in the horizontal direction and then by their apparent mass in the vertical direction.
Purificação: não sem perda da atividade total durante o enriquecimento = aumento da atividade específica! >>> Meta: minimizar perdas! 1 2 3 4 5 Figure 4.13. Electrophoretic Analysis of a Protein Purification. The purification scheme in Table 4.1 was analyzed by SDS-PAGE. Each lane contained 50 mg of sample. The effectiveness of the purification can be seen as the band for the protein of interest becomes more prominent relative to other bands.
Matrix-assisted laser desorption-ionization (MALDI) Time of flight (TOF) Figure 4.16. MALDI-TOF Mass Spectrometry. (1) The protein sample, embedded in an appropriate matrix, is ionized by the application of a laser beam. (2) An electrical field accelerates the ions formed through the flight tube toward the detector. (3) The lightest ions arrive first. (4) The ionizing laser pulse also triggers a clock that measures the time of flight (TOF) for the ions. ESPECTROMETRIA DE MASSA + GENOMA = TDB
Bom e... barato 5 pmol de mistura I + L 2D del>>>PM de fragmentos + PM frags bioinformático = 80% Figure 4.17. MALDI-TOF Mass Spectrum of Insulin and b -lactoglobulin. A mixture of 5 pmol each of insulin (I) and b-lactoglobulin (L) was ionized by MALDI, which produces predominately singly charged molecular ions from peptides and proteins (I + H+ for insulin and L + H+ for lactoglobulin). However, molecules with multiple charges as well as small quantities of a singly charged dimer of insulin, (2 I + H)+, also are produced.
Composição de AA: primeira etapa de seqüenciamento Figure 4.18. Determination of Amino Acid Composition. Different amino acids in a peptide hydrolysate can be separated by ion-exchange chromatography on a sulfonated polystyrene resin (such as Dowex-50). Buffers (in this case, sodium citrate) of increasing pH are used to elute the amino acids from the column. The amount of each amino acid present is determined from the absorbance. Aspartate, which has an acidic side chain, is first to emerge, whereas arginine, which has a basic side chain, is the last. The original peptide is revealed to be composed of one aspartate, one alanine, one phenylalanine, one arginine, and two glycine residues
2: quem é o N terminal? Figure 4.20. Determination of the Amino-Terminal Residue of a Peptide. Dabsyl chloride labels the peptide, which is then hydrolyzed with the use of hydrochloric acid. The dabsyl-amino acid (dabsyl-alanine in this example) is identified by its chromatographic characteristics.
Degradação de Edman (ligação com PTH) Phenil isothiocyanate Figure 4.22. Separation of PTH-Amino Acids. PTH-amino acids can be rapidly separated by high-pressure liquid chromatography (HPLC). In this HPLC profile, a mixture of PTH-amino acids is clearly resolved into its components. An unknown amino acid can be identified by its elution position relative to the known ones.
3: Fragmentar ajuda! Figure 4.23. Cleavage by Cyanogen Bromide. Cyanogen bromide cleaves polypeptides on the carboxyl side of methionine residues. Figure 4.24. Cleavage by Trypsin. Trypsin hydrolyzes polypeptides on the carboxyl side of arginine and lysine residues Figure 4.25. Overlap Peptides. The peptide obtained by chymotryptic digestion overlaps two tryptic peptides, establishing their order.
Figure 4.33. Preparation of Monoclonal Antibodies. Hybridoma cells are formed by fusion of antibody-producing cells and myeloma cells. The hybrid cells are allowed to proliferate by growing them in selective medium. They are then screened to determine which ones produce antibody of the desired specificity
Figure 4.36. Western Blotting. Proteins on an SDS-polyacrylamide gel are transferred to a polymer sheet and stained with radioactive antibody. A band corresponding to the protein to which the antibody binds appears in the autoradiogram
Figure 4.35. Indirect ELISA and Sandwich ELISA (A) In indirect ELISA, the production of color indicates the amount of an antibody to a specific antigen. (B) In sandwich ELISA, the production of color indicates the quantity of antigen
Figure 4.34. Fluorescence Micrograph of a Developing Drosophila Embryo. The embryo was stained with a fluorescent-labeled monoclonal antibody for the DNA-binding protein encoded by engrailed, an essential gene in specifying the body plan. Figure 4.39. Immunoelectron Microscopy. The opaque particles (150-Å, or 15-nm, diameter) in this electron micrograph are clusters of gold atoms bound to antibody molecules. These membrane vesicles from the synapses of neurons contain a channel protein that is recognized by the specific antibody Figure 4.37. Actin Filaments. Fluorescence micrograph of actin filaments in a cell stained with an antibody specific to actin
Figure 4.43. Basis of NMR Spectroscopy. The energies of the two orientations of a nucleus of spin 1/2 (such as 31P and 1H) depend on the strength of the applied magnetic field. Absorption of electromagnetic radiation of appropriate frequency induces a transition from the lower to the upper level. NMR (RMN) Domínios até 15 kDa (55aa) Figure 4.44. One-Dimensional NMR Spectra. (A) 1H-NMR spectrum of ethanol (CH3CH2OH) shows that the chemical shifts for the hydrogen are clearly resolved. (B) 1H-NMR spectrum from a 55 amino acid fragment of a protein with a role in RNA splicing shows a greater degree of complexity. A large number of peaks are present and many overlap. [(A) After C. Branden and J. Tooze, Introduction to Protein Structure (Garland, 1991), p. 280; (B) courtesy of Barbara
Figure 4.45. The Nuclear Overhauser Effect. The nuclear Overhauser effect (NOE) identifies pairs of protons that are in close proximity. (A) Schematic representation of a polypeptide chain highlighting five particular protons. Protons 2 and 5 are in close proximity (~4 Å apart), whereas other pairs are farther apart. (B) A highly simplified NOESY spectrum. The diagonal shows five peaks corresponding to the five protons in part A. The peaks above the diagonal and the symmetrically related one below reveal that proton 2 is close to proton 5. Figure 4.46. Detecting Short Proton-Proton Distances. A NOESY spectrum for a 55 amino acid domain from a protein having a role in RNA splicing. Each off-diagonal peak corresponds to a short proton-proton separation. This spectrum reveals hundreds of such short proton-proton distances, which can be used to determine the three-dimensional structure of this domain
Figure 4.47. Structures Calculated on the Basis of NMR Constraints. (A) NOESY observations show that protons (connected by dotted red lines) are close to one another in space. (B) A three-dimensional structure calculated with these proton pairs constrained to be close together. Figure 4.48. A Family of Structures. A set of 25 structures for a 28 amino acid domain from a zinc-finger-DNA-binding protein. The red line traces the average course of the protein backbone. Each of these structures is consistent with hundreds of constraints derived from NMR experiments. The differences between the individual structures are due to a combination of imperfections in the experimental data and the dynamic nature of proteins in solution.
Figure 4.49. Essence of an X-Ray Crystallographic Experiment: an X-Ray Beam, a Crystal, and a Detector.
Figure 4.51. Myoglobin Crystal and X-Ray. (A) Crystal of myoglobin. (B) X-ray precession photograph of a myoglobin crystal. Figure 4.52. Section of the Electron-Density Map of Myoglobin. This section of the electron-density map shows the heme group. The peak of the center of this section corresponds to the position of the iron atom.
É caro mas pode! (síntese de peptídeos) >>>ANTÍGENO! >>>DROGA Figure 4.40. Vasopressin and Synthetic Vasopressin. Structural formulas of (A) vasopressin, a peptide hormone that stimulates water resorption, and (B) 1-desamino-8-d-arginine vasopressin, a more stable synthetic analog of this antidiuretic hormone.
Figure 4.41. Amino Acid Activation. Dicyclohexylcarbodiimide is used to activate carboxyl groups for the formation of peptide bonds. Síntese em fase sólida Figure 4.42. Solid-Phase Peptide Synthesis. The sequence of steps in solid-phase synthesis is: (1) anchoring of the C-terminal amino acid, (2) deprotection of the amino terminus, and (3) coupling of the next residue. Steps 2 and 3 are repeated for each added amino acid. Finally, in step 4, the completed peptide is released from the resin.