Download
1 / 9
90 likes | 96 Views
This report provides an overview of the global C4ISR market, estimating its size and expected growth. It also highlights key market players, challenges, and trends in various regions. The report emphasizes the increasing demand for integrated solutions and interoperability, as well as the impact of reduced defense budgets on market dynamics. Additionally, it discusses the attractiveness of the market in Saudi Arabia, with projections for C4I IT service spending.

E N D
C4I market overviewGlobal and KSA April 2015 Shared By Fozan Alfozan
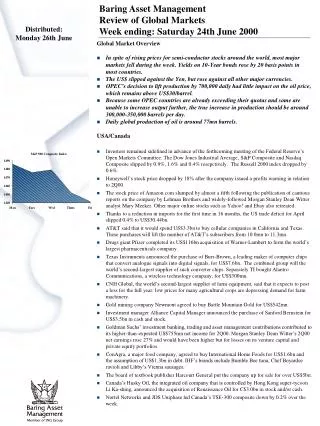
Global C4iSR market size The global C4ISR market is estimated at $102 billion in 2014 and is expected to register a CAGR of 3%-4.5% to reach between $122 and $133 billion by 2020 Global C4ISR market size and forecast ($ Billions) Key facts • The continued requirement for integrated solutions and interoperability will be the driving factors for the global C4ISR market • While emphasis on networked forces is spreading to all nations seeking to modernize their C4ISR systems, reduced defense budgets, force structures, tables of equipment and platforms are becoming major challenges, especially in North America and Western Europe (especially UK) • Increased spending by Middle Eastern and APAC nations drive improved sensors, processing and communications • Of-the-shelf products are lacking standardization, and have questionable supply chain integrity and component reliability, but still their acquisition reduces costs, speeds procurement schedules, eases integration and promotes more frequent technology refreshes • The C4ISR market is a diversified and competitive, with the presence of a significant number of players, but the primary market players are from the United States and Europe. Their strategies are expanding geographic footprint towards the emerging economies such as Turkey, Indonesia, Australia and Brazil • The market requires more consolidation and integration of C4ISR systems across all platforms to gain a competitive advantage 2.9%-4.5% Source: Frost & Sullivan, SDI, Web research
C4ISR market by geography NA share of global C4ISR expenditure will diminish, while Europe will hold a steady growth; APAC and ME will increase their share in the total C4ISR Spend pattern changes (%) 2014 2020 Africa Africa Latin America Latin America Middle East Middle East North America North America Asia Pacific Asia Pacific Europe Europe Source: Frost & Sullivan
C4ISR by segments C4I represents almost 60% of the overall C4ISR market % of total global C4ISR 2012-2021 C4I 14.1% 25.5% 9.6% 10.1% 32.6% 8.1% Command and control (C2) Communications Computers Intelligence S&R EW/IO • Antennas • Cybersecurity • Information assurance • Networks • Satellite • Telecommuni-cations • Antennas • Battle management • Components • Cybersecurity • Datalinks • Information assurance • Multipurpose • Networks • Radio • Satellite communications • Smartphones • Telecommuni-cations • Cloud computing • Components • Cybersecurity • Data analytics • Displays • Hardware • Mobile devices • Multipurpose • Networks • Software • Geospatial intelligence • Human intelligence • Imagery/video • Language/culture • Measurement and signature intelligence • Multipurpose • Networks • Processing exploitationdissemination • Signals intelligence • Biometrics • Chemical, biological, radiological, nuclear, high-yield explosives • EO/IR/MS/laser • Full motion video • GPS • Identification friend or foe • Motion detection • Multipurpose • Night vision • Radar/Lidar • Sonar/acoustic/magnetic • Targeting pods • Unmanned vehicles • Weather • Information operations tools • IR countermeasures • Multipurpose • Radio frequencycountermeasures • Rada warning recievers Source: Frost & Sullivan
C4ISR Market country attractiveness Saudi Arabia is considered to be one of the most attractive C4ISR markets in terms of high spend and significant growth Country attractiveness grid (Global), 2012-2021 Sector with most attractive market in the world over 2012-2021 High 1 From 2014, C4I (as a subset of C4ISR) in KSA will grow at a 2.8% CAGR in defence and HLC sector India 10% 2 Saudi Arabia High 3 Brazil 7.5% 4 South Korea 4 5 US ($437.39bn) 1 2 3 6 UK Medium C4ISR Growth rate Medium 5% 7 9 France 10 8 8 Germany 6 7 9 Australia 2.5% Low 10 Turkey 5 High (>$40bn) Medium ($20bn-$40bn) Low (<$20bn) Low $30bn $10bn Medium High Low Level of C4ISR spending HLS – Homeland security Source: Frost & Sullivan analysis
SAUDI arabia DEFENCE & HLS market Total Saudi Arabia C4I IT service market in 2014 was worth around $632 millions C4I IT service expenditures as a share of total defence & HLS spending (2014, $ Millions) HLS – Homeland security Source: SIPRI, CSIS, Delta Partners analysis
SAUDI arabiac4i DEFENCE & HLS it service spending Saudi Arabia C4I IT service spending will grow at 2.8% CAGR; Army will be the major investor in C4I, but HLS will be the fastest growing market Total C4I defence & HLS IT service spending 2014 – 2019 ($ Millions) Defence & HLS C4I IT service market ($ Millions) CAGR '14 – '19 2.8% (%) 2.1% 0.3% Navy Air Force 0.3% Air defence 2.6% Army 9% HLS HLS – Homeland security Source: SIPRI, CSIS, Delta Partners analysis
41 KSA defence expenditures evolution Kingdom's defence spending has been increasing fueled by high Oil price KSA defencespend relative to oil price ($ Billions, $ oil price/barrel) Oil price Defence budget 51.61 Notes: 1 WTI crude oil price on 12.04.2015 Source: Forbes, SIPRI
World defence expenditures KSA defence expenditures as share of GDP are double compared to the nearest country Military expenditures in 2013 ($ Billions, Top 10 countries) Defence expenditures as share of GDP in 2013 (%) Source: Economist