Download
1 / 7
70 likes | 80 Views
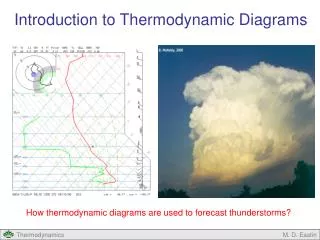
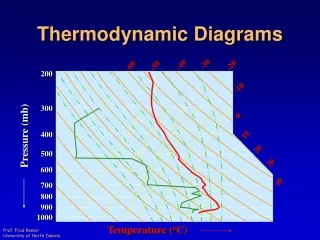
Phase diagrams by thermodynamic calculations. Basics of thermodynamics : lections 1 and 2 Experimental methods to measure thermodynamic properties: lection 3 Phase diagrams of unary, binary and ternary systems: lections 4, 5 and 6 Potential diagrams : lection 7

E N D
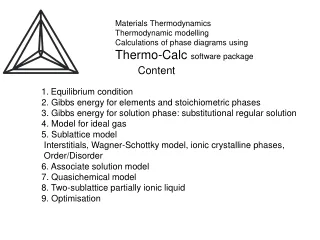
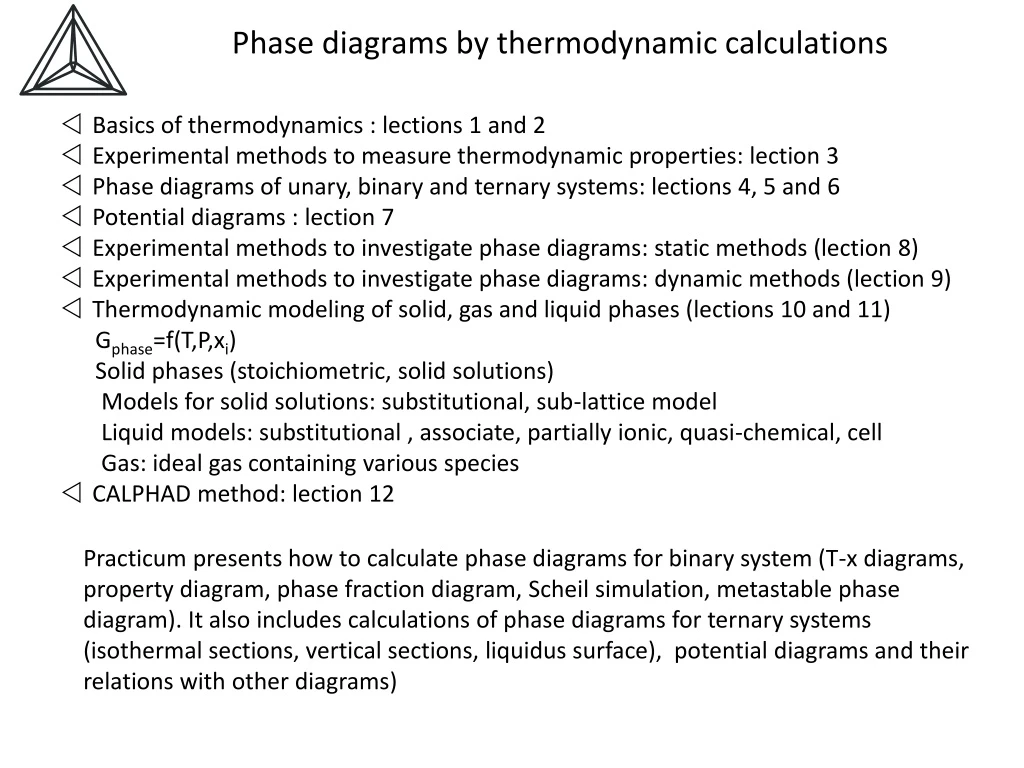
Phase diagrams by thermodynamic calculations • Basics of thermodynamics : lections 1 and 2 • Experimental methods to measure thermodynamic properties: lection 3 • Phase diagrams of unary, binary and ternary systems: lections 4, 5 and 6 • Potential diagrams : lection 7 • Experimental methods to investigate phase diagrams: static methods (lection 8) • Experimental methods to investigate phase diagrams: dynamic methods (lection 9) • Thermodynamic modeling of solid, gas and liquid phases (lections 10 and 11) • Gphase=f(T,P,xi) • Solid phases (stoichiometric, solid solutions) • Models for solid solutions: substitutional, sub-lattice model • Liquid models: substitutional , associate, partially ionic, quasi-chemical, cell • Gas: ideal gas containing various species • CALPHAD method: lection 12 Practicum presents how to calculate phase diagrams for binary system (T-x diagrams, property diagram, phase fraction diagram, Scheil simulation, metastable phase diagram). It also includes calculations of phase diagrams for ternary systems (isothermal sections, vertical sections, liquidus surface), potential diagrams and their relations with other diagrams)
Phase diagram is a chart showing conditions (pressure, temperature, composition , volume etc.) at which thermodynamically distinct phases occur and coexist in equilibrium. Unary system Gibbs energy G Temperature The Gibbs energy of phase with constant composition at temperature T is expressed by GT = HT - ST ∙T, where HT and ST are enthalpy and entropy at temperature T. The enthalpy and entropy at temperature T are expressed by equations: where DH0f,el298 is enthalpy of formation from elements, S0298 standard entropy and CP is heat capacity, which also depends on temperature: CP= A+B∙T+C/T2 (Maier – Kelly equation)
Binary phase diagrams The Gibbs energy of solution phase depends on pressure, temperature and composition x: G(T,p,x) Temperature Ideal behavior G, Gibbs energy Ideal behavior Activity Activity Mole fraction xB Mole fraction Mole fraction
Ternary phase diagrams Liquidus surface Isothermal sections
Ternary Four-Phase Equilibrium Eutectic Vertical sections (Isopleths)
Potential diagrams Types of diagrams: 1. Potential diagrams – two potentials 2. Mixed diagrams – one potential and one ratio of extensive properties 3. Extensive properties diagrams – two ratios of extensive properties
THERMO-CALC software for thermodynamic calculations SYS: go to module DATABASE, Scheil, BIN, TERN To make Scheil simulation, or to calculate phase diagram in BIN or TER module go da - go to database module TDB Database selection (user, commercial databases TCFE6, SSUB4) sw-da switch database def-e define elements - elements selection l-sys list system (elements, phases, constituents) Constituents - list of phases with models used get go TAB (calculate thermodynamic properties of phases or reactions) go gi (Gibbs energy system ) l-p-d (see phase description ) l-d list data to make new database or TCM file for PARROT go POLY3 Calculate single equilibrium set-cond (set conditions T, P ,xi-xn-1, N=1) c-e compute equilibrium l-e list equilibrium 2. Calculations of phase diagrams by step or map s-a-v 1 x(el) 0 1 0.01 (ranges of axis variable and increment ) one axis – step command (e.g. to calculate mixing enthalpy vs. composition) two axis – map (e.g. x-T diagram, isothermal section) three axis – map (liquidus surface) PARROT Optimisation of parameters Post (to see the diagram)