Download
1 / 31
310 likes | 316 Views
Chapter 6 The Risk and Term Structure of Interest Rates. Preview. In this chapter, we examine the sources and causes of fluctuations in interest rates relative to one another, and look at a number of theories that explain these fluctuations. Learning Objectives.

E N D
Chapter 6 The Risk and Term Structure of Interest Rates
Preview • In this chapter, we examine the sources and causes of fluctuations in interest rates relative to one another, and look at a number of theories that explain these fluctuations.
Learning Objectives • Identify and explain three factors explaining the risk structure of interest rates. • List and explain the three theories of why interest rates vary across maturities.
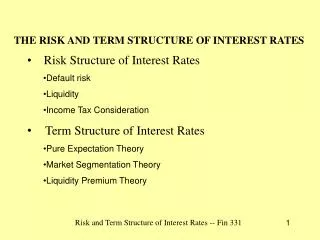
Risk Structure of Interest Rates • Bonds with the same maturity have different interest rates due to: • Default risk • Liquidity • Tax considerations
Figure 1 Long-Term Bond Yields, 1919–2014 Sources: Board of Governors of the Federal Reserve System, Banking and Monetary Statistics, 1941–1970; Federal Reserve Bank of St. Louis FRED database: http://research.stlouisfed.org/fred2
Risk Structure of Interest Rates • Default risk: probability that the issuer of the bond is unable or unwilling to make interest payments or pay off the face value • U.S. Treasury bonds are considered default free (government can raise taxes). • Risk premium: the spread between the interest rates on bonds with default risk and the interest rates on (same maturity) Treasury bonds
Figure 2 Response to an Increase in Default Risk on Corporate Bonds • Price of Bonds, P • Price of Bonds, P Sc • Risk • Premium • Quantity of Corporate Bonds • Quantity of Treasury Bonds • (b) Default-free (U.S. Treasury) bond market • (a) Corporate bond market Step 1. An increase in default risk shifts the demand curve for corporate bonds left . . . Step 2. and shifts the demand curve for Treasury bonds to the right . . . Step 3. which raises the price of Treasury bonds and lowers the price of corporate bonds, and therefore lowers the interest rate on Treasury bonds and raises the rate on corporate bonds, thereby increasing the spread between the interest rates on corporate versus Treasury bonds.
Table 1 Bond Ratings by Moody’s, Standard and Poor’s, and Fitch
Risk Structure of Interest Rates • Liquidity: the relative ease with which an asset can be converted into cash • Cost of selling a bond • Number of buyers/sellers in a bond market • Income tax considerations • Interest payments on municipal bonds are exempt from federal income taxes.
Figure 3 Interest Rates on Municipal and Treasury Bonds Price of Bonds, P Price of Bonds, P ST Sm Quantity of Municipal Bonds Quantity of Treasury Bonds (b) Market for Treasury bonds (a) Market for municipal bonds Step 1.Tax-free status shifts the demand for municipal bonds to the right . . . Step 2.and shifts the demand for Treasury bonds to the left . . . Step 3.with the result that municipal bonds end up with a higher price and a lower interest rate than on Treasury bonds.
Effects of the Obama Tax Increase on Bond Interest Rates • In 2013, Congress approved legislation favored by the Obama administration to increase the income tax rate on high-income taxpayers from 35% to 39%. Consistent with supply and demand analysis, the increase in income tax rates for wealthy people helped to lower the interest rates on municipal bonds relative to the interest rate on Treasury bonds.
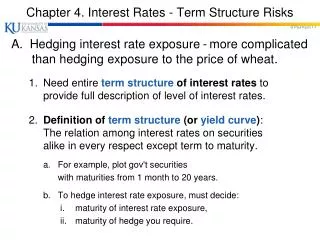
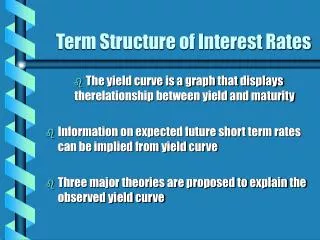
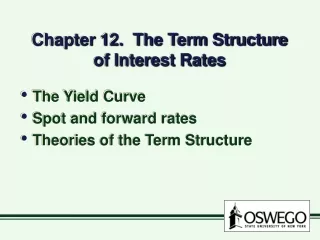
Term Structure of Interest Rates • Bonds with identical risk, liquidity, and tax characteristics may have different interest rates because the time remaining to maturity is different
Term Structure of Interest Rates • Yield curve: a plot of the yield on bonds with differing terms to maturity but the same risk, liquidity and tax considerations • Upward-sloping: long-term rates are above short-term rates • Flat: short- and long-term rates are the same • Inverted: long-term rates are below short-term rates
Term Structure of Interest Rates The theory of the term structure of interest rates must explain the following facts: • Interest rates on bonds of different maturities move together over time. • When short-term interest rates are low, yield curves are more likely to have an upward slope; when short-term rates are high, yield curves are more likely to slope downward and be inverted. • Yield curves almost always slope upward.
Term Structure of Interest Rates Three theories to explain the three facts: • Expectations theory explains the first two facts but not the third. • Segmented markets theory explains the third fact but not the first two. • Liquidity premium theory combines the two theories to explain all three facts.
Figure 4 Movements over Time of Interest Rates on U.S. Government Bonds with Different Maturities Sources: Federal Reserve Bank of St. Louis FRED database: http://research.stlouisfed.org/fred2/
Expectations Theory • The interest rate on a long-term bond will equal an average of the short-term interest rates that people expect to occur over the life of the long-term bond. • Buyers of bonds do not prefer bonds of one maturity over another; they will not hold any quantity of a bond if its expected return is less than that of another bond with a different maturity. • Bond holders consider bonds with different maturities to be perfect substitutes.
Expectations Theory An example: • Let the current rate on one-year bond be 6%. • You expect the interest rate on a one-year bond to be 8% next year. • Then the expected return for buying two one-year bonds averages (6% + 8%)/2 = 7%. • The interest rate on a two-year bond must be 7% for you to be willing to purchase it.
Expectations Theory • Expectations theory explains: • Why the term structure of interest rates changes at different times. • Why interest rates on bonds with different maturities move together over time (fact 1). • Why yield curves tend to slope up when short-term rates are low and slope down when short-term rates are high (fact 2). • Cannot explain why yield curves usually slope upward (fact 3)
Segmented Markets Theory • Bonds of different maturities are not substitutes at all. • The interest rate for each bond with a different maturity is determined by the demand for and supply of that bond. • Investors have preferences for bonds of one maturity over another. • If investors generally prefer bonds with shorter maturities that have less interest-rate risk, then this explains why yield curves usually slope upward (fact 3).
Liquidity Premium & Preferred Habitat Theories • The interest rate on a long-term bond will equal an average of short-term interest rates expected to occur over the life of the long-term bond plus a liquidity premium that responds to supply and demand conditions for that bond. • Bonds of different maturities are partial (not perfect) substitutes.
Preferred Habitat Theory • Investors have a preference for bonds of one maturity over another. • They will be willing to buy bonds of different maturities only if they earn a somewhat higher expected return. • Investors are likely to prefer short-term bonds over longer-term bonds.
Figure 5 The Relationship Between the Liquidity Premium (Preferred Habitat) and Expectations Theory Liquidity Premium (Preferred Habitat) Theory Yield Curve Interest Rate, int Liquidity Premium, lnt 0 5 10 15 20 25 30 Years to Maturity, n Expectations Theory Yield Curve
Liquidity Premium & Preferred Habitat Theories • Interest rates on different maturity bonds move together over time; explained by the first term in the equation • Yield curves tend to slope upward when short-term rates are low and to be inverted when short-term rates are high; explained by the liquidity premium term in the first case and by a low expected average in the second case • Yield curves typically slope upward; explained by a larger liquidity premium as the term to maturity lengthens
Figure 6 Yield Curves and the Market’s Expectations of Future Short-Term Interest Rates According to the Liquidity Premium (Preferred Habitat) Theory Yield to Maturity Yield to Maturity Steeply upward-sloping yield curve Mildly upward-sloping yield curve Term to Maturity Term to Maturity (a) (b) Yield to Maturity Yield to Maturity Downward-sloping yield curve Flat yield curve Term to Maturity Term to Maturity (c) (d)