Download
1 / 20
200 likes | 343 Views
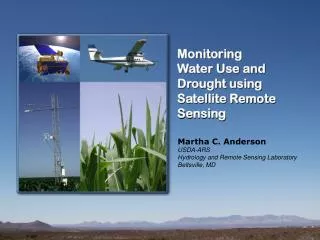
Mapping Phenology, Water Use and Drought using Landsat Imagery. Feng Gao, Kathryn Semmens, Martha Anderson. USDA-Agricultural Research Service Hydrology and Remote Sensing Laboratory Beltsville, MD 20705. USDA is an equal opportunity provider and employer. TOOLS. STARFM. Multi-sensor data

E N D
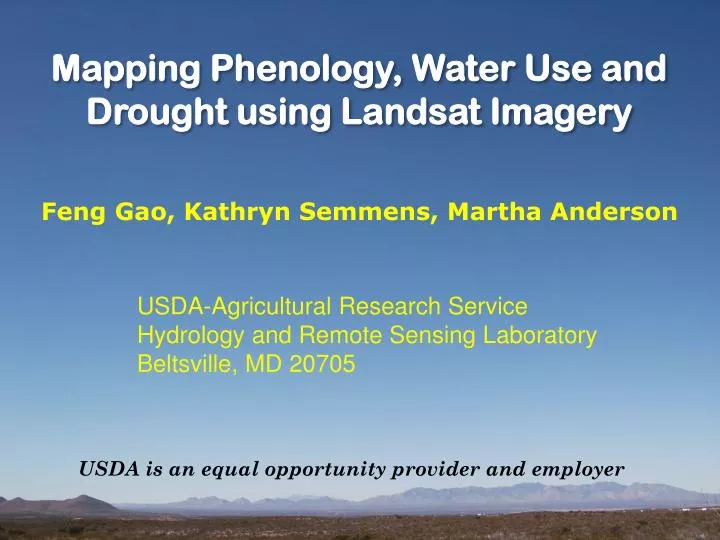
Mapping Phenology, Water Use and Drought using Landsat Imagery Feng Gao, Kathryn Semmens, Martha Anderson USDA-Agricultural Research Service Hydrology and Remote Sensing Laboratory Beltsville, MD 20705 USDA is an equal opportunity provider and employer
TOOLS STARFM Multi-sensor data fusion Project overview DMS Thermal image sharpening APPLICATIONS (daily/30 m) ALEXI Multi-scale ET modeling Crop phenology metrics ASSETS SW/TIR Crop water use (Evapotranspiration) GEO Hourly 5km/5km Crop stress (drought early warning) MODIS Daily 250m/1km Landsat 16 day 30m/100m Lsat-like ~20-60m/ --
Data Mining Sharpener L5, 2011-247 (9/4) L7, 2013-244 (9/1) L8, 2013-252 (9/9) Org. T B10 DMS T Range (in K): (287-295) (292-300) (300-308) - L8 TIRS captured small variations that were uniform in L5 and L7, also smoother - L8 VNIR bands show more details -> better sharpening results (e.g. small ponds) (WRS-2 path 26 and row 31, central Iowa, 41.21554N, 93.0337W)
Overfly L7 & L8 (Org.) p38r35 (NW AZ) 2013-088 (Mar. 29) Tool: DMS L8, B10 L7, B6
Overfly L7 & L8 (Sharp) p38r35 (NW AZ) 2013-088 (Mar. 29) Tool: DMS L8, B10 L7, B6
L7, 2013-244 L8, 2013-252 Sharpened T Original T L7(432)/ L8 (543)
FIELD-SCALE PHENOLOGIC METRICS APP: Crop Phenological Metrics MODIS STARFM Landsat Lsat-like • Phenology • start of season • end of season • peak greenness • start of senescence • … …
Study Area: South Fork, Iowa WRS-2 Path 26 Row 31 Cropland Data Layer (2011) (six pairs of Landsat and MODIS images from July 2 to Nov. 7, 2011)
April 1 (91) April 15 (105) May 1 (121) May 15 (135) June 1 (152) June 15 (166) July 1 (182) July 15 (196) August 1 (213) August 15 (227) September 1 (244) September 15 (258) October 1 (274) October 15 (288) November 1 (305) STARFM NDVI Results 0.0 0.2 0.4 0.6 0.8 1.0
APP: Crop Phenological Metrics 0.0 0.5 1.0 Smoothed Daily NDVI, Apr. 1 – Nov. 1, 2011
Crop Growth Stages & Remote Sensing Phenology APP: Crop Phenological Metrics
Typical Cover Types (3 Landsat Pixels) APP: Crop Phenological Metrics
Time for the Start of the Season (P1) APP: Crop Phenological Metrics 60 120 180
Time for the End of the Season (P2) APP: Crop Phenological Metrics 260 280 300
Rate of Decrease (right slope, P9) APP: Crop Phenological Metrics 0.0 0.012 0.025
Summary L8 TIRS sharpening results (30m) show comparable spatial details to the results sharpened from L7 ETM+ Annual crop phenology were extracted using L5, L7 and MODIS. We will test L7 and L8 combination when L8 surface reflectances are available.
Fusion tools and products = understanding Evaporative Stress signal Negative ET anomalies: -phenological shift (i.e. planted to emerged) -variable acreage planted -soil moisture deficit -variable response reflective of vegetation type -water management Can only determine primary cause at field scale through Landsat Cause influences management action
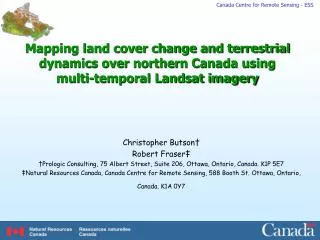
Study Sites Time series (2000-2013) of Fusion data products (Daily ET at Landsat resolution) • Mead, Nebraska middle of cornbelt, auxiliary datasets for validation, hail damage 2004 • Ames, Iowa effects of phenology and unplanted acreage • North Dakota (Red River Valley) effects of changes in land management (tile drainage installation)
Consequences of Landsat coverage gap Landsat 9 2020 2030 Landsat 8 2013 Lost opportunities to determine stress causes 2012 severe drought year BUT little Landsat data Need to be proactive and plan for Landsat 9 now to eliminate gaps