Download
1 / 19
190 likes | 308 Views
Mapping a Problem Solving Rubric to Faculty Perceptions. Andrew J. Mason 1 , Brita Nellermoe 1,2 1 Physics Education Research and Development University of Minnesota, Twin Cities, Minneapolis, MN 2 University of St. Thomas, St. Paul, MN MAAPT-WAPT Joint Meeting October 29-30, 2010.

E N D
Mapping a Problem Solving Rubric to Faculty Perceptions Andrew J. Mason1, Brita Nellermoe1,2 1Physics Education Research and Development University of Minnesota, Twin Cities, Minneapolis, MN 2University of St. Thomas, St. Paul, MN MAAPT-WAPT Joint Meeting October 29-30, 2010
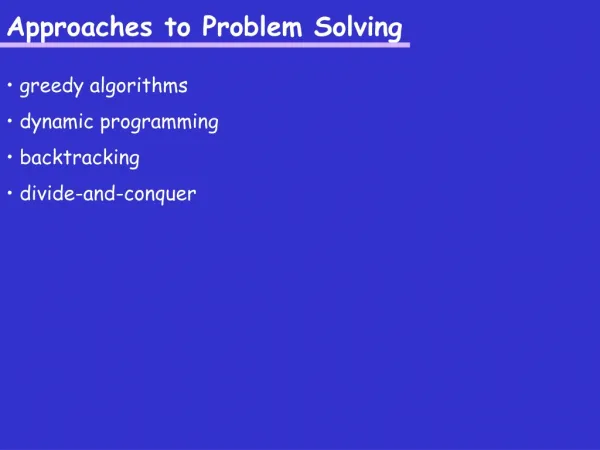
Table of Contents • Background • Faculty Perceptions of Student Problem Solving1 • Rubric for Student Problem Solutions2 • Why are we looking at these two together? • Analysis • Artifact categorization activity • How to analyze it? • Results • Classification of index cards • Classification of chosen categories • Future work • 1Yerushalmi et al. 2007, Henderson et al. 2007 • 2Docktor 2009
Faculty Interviews about Problem Solving (Yerushalmi, Henderson et al. 2007) • Purpose: to find out what instructors believe and value about teaching and learning problem solving • Concept map models illustrate what faculty are looking for • Can inform curriculum developers so that they can be consistent with instructor beliefs
Faculty Interviews (Yerushalmi, Henderson et al. 2007) • Interviews carried out with 30 faculty • different representation: Community Colleges (CC), Private Colleges (PC), State Universities (SU), Research University (RU) • 2 interviewers – method consistent • Participants studied problem statements, student artifacts and faculty artifacts • Generated their own artifacts, i.e. conversation topics • Then categorized their own artifacts as the last task • This is the task we are interested in
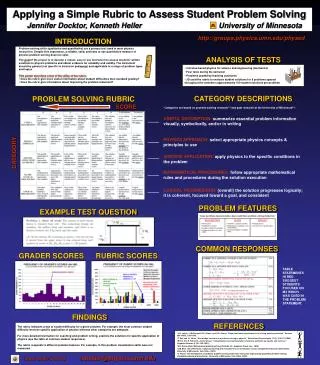
Rubric for Analysis of Problem Solving (Docktor 2009) • Focus: minimum set of problem solving categories by which a written problem solution may be evaluated • Validity, inter-rater reliability have been tested • Five such categories: • Useful Description (UD) • Physics Approach (PA) • Specific Application of Physics (SAP) • Mathematical Procedures (MP) • Logical Progression (LP)
What are we trying to do? • Rubric categories can be used to examine beliefs and values expressed by faculty in interviews • Research Questions: • Is it valid to use the rubric, and if so, how? • What does the rubric tell us about individual cards and categories? • Future: How can we weigh context of individual cards and categories?
Valid Use of Rubric? • Can see how many artifacts can fit in each given category • Rubric is meant for problem solving - can we interpret faculty artifacts with it? • Interviews focused on problem solving • If at least the individual cards, and possibly faculty categories, can mostly fit into rubric categories, then tool is valid
Analysis Procedure: Categorization Task • 2 raters use rubric for categorization • Establish inter-rater reliability using sample of 5 faculty distributed evenly across SU, PC, and CC • Split the other 25, random selection, and categorize • Agreement established with discussion • Do this for individual artifact cards and then faculty-chosen categories
Analysis Procedure: Categorization Task • Things to look at: • Overall category performance, all 30 faculty • Institution type • Interviewer check
Results: Individual Faculty Artifacts • 2.5% of individual faculty artifacts don’t fit into at least one rubric category (meaning 97.5% do) • Examples that don’t fit: confidence, very vague ideas • Individual category focus • PA has the highest percentage overall • UD and SAP are second most • MP and LP are focused on but not as much as the other three
Results: Individual Faculty Artifacts - RU professors focus more heavily on PA, less heavily on UD and MP - Other institutions seem to focus roughly the same way on all categories, although PC tends to focus a bit more on LP and a bit less on UD
Results: Individual Faculty Artifacts • Groups are mostly evenly balanced by interviewer • Only bit of difference seems to result from RU skewing (PA)
Results: Faculty Category Artifacts - It’s somewhat more difficult to classify overall categories
Results: Faculty Category Artifacts - RU categories focus more heavily on PA and SAP, none for MP - SU categories also focus heavily on PA, a bit more on UD - CC, PC are similar
Results: Faculty Category Artifacts • Discrepancy in faculty categories between interviewers (CBC vs. MP) • This is independent of institution type (not a result of skewing)
Present and Future Work • Need to consider context of interviews • Faculty categories can’t be matched as well as individual cards can – any further insight? • Are interviewers interpreting categories differently? • How to treat possible qualitative difference between value of artifacts? • e.g. overall principle vs. comment on student solution
Present and Future Work • 10 interviews sampled for context • Taken from beginning, middle and end of interview period • Even sampling from different interviewers, institutions • All references to cards, categories marked down via Ctrl+F • How to evaluate qualitative difference between items? • How to relate categories to individual cards?
Thanks! • For more information visit http://groups.physics.umn.edu/physed/