Download
1 / 20
200 likes | 316 Views
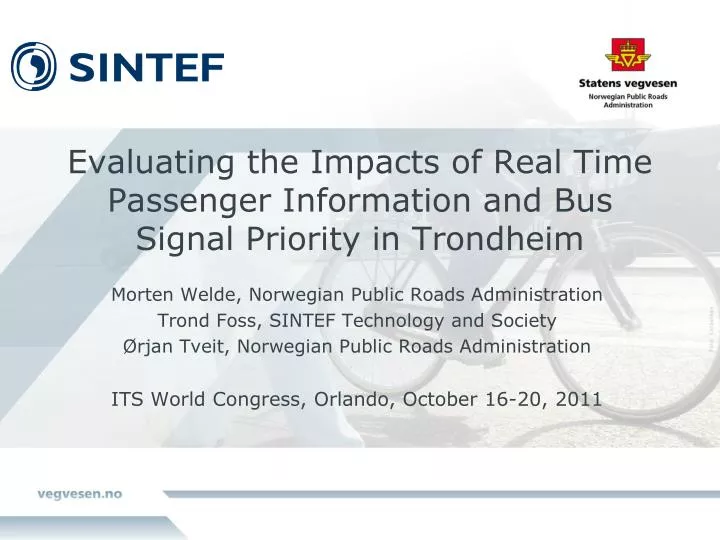
Evaluating the Impacts of Real Time Passenger Information and Bus Signal Priority in Trondheim. Morten Welde, Norwegian Public Roads Administration Trond Foss, SINTEF Technology and Society Ørjan Tveit, Norwegian Public Roads Administration ITS World Congress, Orlando , October 16-20, 2011.

E N D
Evaluating the Impacts of Real Time Passenger Information and Bus Signal Priority in Trondheim Morten Welde, Norwegian Public Roads Administration Trond Foss, SINTEF Technology and Society Ørjan Tveit, Norwegian Public Roads Administration ITS World Congress, Orlando, October 16-20, 2011
Objectives • To demonstrate that ITS projects can and should be evaluated to demonstrate their effects • To prove, using the implementation of real time passenger information and bus signal priority in Trondheim, that ITS based solutions for public transport provide posititive effects and are profitable from an economic point of view • To encourage the proponents of ITS solutions in the transport sector that economic evaluation is an asset for securing ITS investments
Presentation outline • Background • Public transport in Trondheim • Hypothesised effects • Results • Conclusions
2. Public Transport in Trondheim • Population: 175.000 • Modal share: Car: 60%, Walking: 20%, PT: 10%, Bike: 10% • Total number of bus trips per year: 18 mill. • ⅔ of costs covered by ticket revenues • Buses, one tram line and trains to and from neighbouring towns and regions • Gross subsidy tendering, services planned and managed by PT authority AtB – a subsidiary of the regional authorities
1. Background: Why ITS? • ITS based projects are an asset to the transport sector for various reasons: • Enhances mobility • Improves accessibility • Improves traffic safety • However, the merits of other types of projects are gauged using economic frameworks such as cost benefit analysis (CBA), but not ITS • ITS based projects stand to loose in competition for funds unless its merits can be demonstrated!
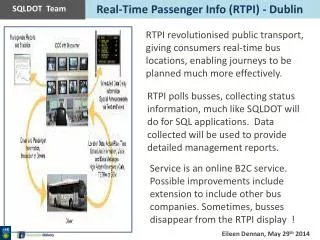
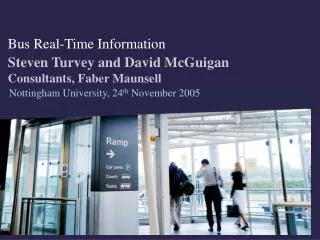
Real time passenger information (RTPI) and bus signal priority in Trondheim • Introduced in February 2011 • All buses and 35 bus stops now have screens which inform passengers of next bus stop (on buses) and expected arrival time of next bus • RTPI available on mobile phones and audio systems for the visually impaired also available • Bus signal priority in 50 junctions • A range of measures are introduced through the ‘Environmental package Trondheim’ to increase the attractivity of public transport
The “Environmental package Trondheim” • “Miljøpakke Trondheim” (Environmental package Trondheim) an ambitious programme to improve the environment and Trondheim’s transport system: • Reduce CO2 emissions by 20 % • Increase walking/cycling/PT by 50 % • Reduce the private car share of all trips to 50 % • Increase the speed of PT by 40 % • Reduce people exposed to harmful road noise by 15 % • Reduce traffic accidents by 20 % • Revenues to finance investments in PT, facilities for walkers/cyclists, road projects and subsidies to PT • 50 % for roads, 50 % other ‘soft’ measures • A toll cordon with tolls $ 1.50 − $ 3.50, depending on time of day
3. Hypothesised effects • Hypothesis 1: RTPIwill reduce bus dwell time. • Hypothesis 2: RTPIwill reduce passengers’ wait time. • Hypothesis 3: RTPIwill increase passenger satisfaction. • Hypothesis 4:RTPIwill increase the total number of passengers. • Hypothesis 5:Bus signal priority will reduce total bus travel time. • Hypothesis 6:Bus signal priority will reduce bus delays at signals.
4. Results • RTPI • Bus signal priority • Cost-benefit analysis
Have RTPI reduced bus dwell time? Significant? NO
Have RTPI reduced passengers’ wait time? Significant? NO/YES
Does RTPI increase passenger satisfaction? (n = 1066) • Some results from the survey: • 75% of the respondents were satisfied with today’s bus services, 17% was dissatisfied while the remaining 8% had no opinion • 42% of respondents felt that bus services had improved while the rest felt that the quality was unchanged. • Over 50% of respondents agree that wait time at bus stops is short, while some 33% feel that average wait time is too long • Over 50% have not experienced any improvements in wait time since 2010, 24% have experienced an improvement, 18% have not formed an opinion, while 7% feels wait time has become worse.
Has bus signal priority reduced total travel time and bus delays at signals? • Although a considerable amount of data was collected and many different types of analyses were carried out it was not possible to achieve a clear and significant answer to Hypothesis 5 and 6. • The results point in several directions and the main conclusion from this part of the evaluation is that a long period of study both before and after the implementation is needed and extensive data collection is necessary in order to achieve reliable results. • A major challenge in the evaluation was to separate the impacts of the bus priority measure from all other variables, e.g. traffic variations and variations in the number of passengers boarding or leaving the bus stops on the road section studied. • The effects of bus signal priority will continue to be monitored in order to enable us to draw final conclusions regarding the effects of this measure.
Conclusions bus signal priority Inconclusive!
A cost benefit analysis of RTPI • Overall assumptions used in the estimation: • Time frame for analysis: 25 years • Expected life time of investments: 12 years • Discount rate: 4.5% • Average VAT rate: 6% • Marginal cost of public funds: 20% • Benefit per trip when RTPI is available: $ 0.70
CBA results Low costs, high benefits
5. Conclusions • RTPI and bus signal priority are measures well suited to increase the quality of public transport • Along with other measures this could increase passenger numbers and encourage modal shift • Evaluation by means of CBA demonstrates that RTPI provides significant value for money Thank you!
Evaluating the Impacts of Real Time Passenger Information and Bus Signal Priority in Trondheim Morten Welde, Norwegian Public Roads Administration Trond Foss, SINTEF Technology and Society Ørjan Tveit, Norwegian Public Roads Administration ITS World Congress, Orlando, October 16-20, 2011