Download
1 / 17
170 likes | 315 Views
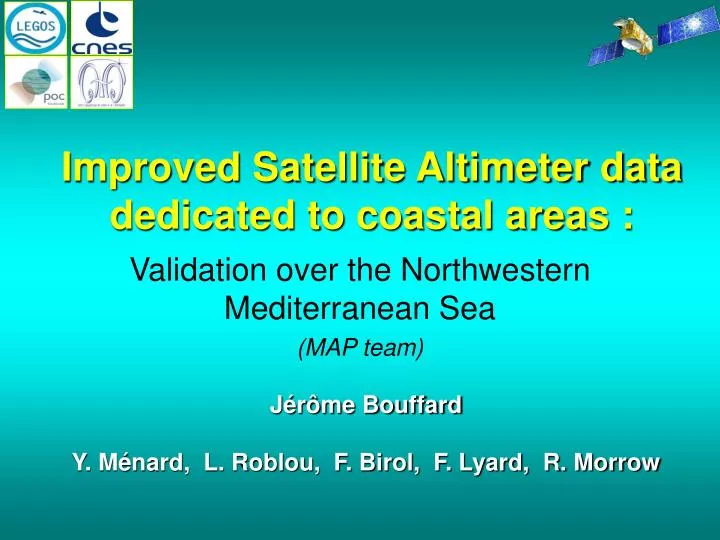
Improved Satellite Altimeter data dedicated to coastal areas :. Validation over the Northwestern Mediterranean Sea (MAP team). Jérôme Bouffard Y. Ménard, L. Roblou, F. Birol, F. Lyard, R. Morrow. Liguro Provencal Catalan (LPC) current Complex small mesoscale dynamics (Send, 1999)

E N D
Improved Satellite Altimeter data dedicated to coastal areas : Validation over the Northwestern Mediterranean Sea (MAP team) Jérôme Bouffard Y. Ménard, L. Roblou, F. Birol, F. Lyard, R. Morrow
Liguro Provencal Catalan (LPC) current Complex small mesoscale dynamics (Send, 1999) LPC Instability + meanders (Conan and Millot, 1995) Seasonnal variability (Millot 1991) Altimetric tracks: - Topex/poseidon - Envisat - jason 1 - GFO Tide gauges: Gulf of Genoa Ligurian Sea Gulf of Lion Corsica Channel LPC Current Latitudes Catalan Sea Western Mediterranean Sea Balear islands Algerian Bassin Longitude Context Are altimeter data valuable in coastal areas ? How to improve altimeter data in coastal areas?
Available data Standard distributed data: AVISO regional along-track product: DT-(M)SLA “Upd” Features: • Standard editing • MOG2D Global (w+P) + FES2004 (tide) corrections • Along-track sampling every 7km (~ 1HZ) • Large scale and orbit error reduction (Le Traon et Ogor, 1998) Improved coastal data: Margins Altimetry Projects (MAP) : Xtrack SLA (see Lyard et al OSTST 2007) Features: • Specific editing and correction re-building • MOG2D -Medsea (w+P) + MOG2D-Medsea (tide) corrections • High resolution sampling every 350 or 700 m (~ 10HZ/ 20 HZ)
Impact of the processing features Example at the Nice TG
Comparisons at the Nice TG: % of RMS explained: Impact of regional de-aliasing corrections Nice TG Nice TG Correlation: 0.78 Residual RMS: 3.9 cm RMS explained: 37% Regional de-aliasing MAP-Xtrack Medsea Correlation: 0.75 Residual RMS: 4.1 cm RMS explained: 33% % 10 40 MOG2D Medsea (Regional configuration) significantly improves the consistency beween the altimeter and the Nice tide gauge time series. Global de-aliasing MAP-Xtrack Global
Comparisons at the Nice TG: % of RMS explained: Impact of the dataediting methodology Nice TG Nice TG Correlation: 0.78 Residual RMS: 3.9 cm RMS explained: 36% Correlation: 0.81 Residual RMS: 3.7 cm RMS explained: 40% Standard editing Specific editing MAP-Xtrack Medsea HF MAP-xtrack Medsea HF no editing The specific data editing methodology allows to decrease the noise in the altimeter time series % 10 40
Comparisons at the Nice TG: % of RMS explained: Impact of the High Frequency sampling Nice TG Nice TG Correlation: 0.78 Residual RMS: 3.9 cm RMS explained: 37% Correlation: 0.81 Residual RMS: 3.7 cm RMS explained: 40% HF sampling 1HZ sampling MAP-Xtrack Medsea HF MAP-Xtrack Medsea % 10 40 The high frequency sampling allows to go closer to the coast
Comparisons of the Map-Xtrack data with a regional standard product Example at the Nice Tide Gauge
Comparisons at the Nice TG: Number of dataMAP-Xtrack Medsea HFvsDT-(M)SLA Upd Nice TG Nice TG 115 125 115 125 MAP product AVISO product MAP-Xtrack Medsea HF DT-(M) SLA Upd The MAP-Xtrack processing allows to recover more data far and close to the coast
Comparisons at the Nice TG: % of RMS explained:MAP-Xtrack Medsea HFvsDT-(M) SLA Upd Correlation: 0.81 % of RMS explained: 40.4 Correlation: 0.79 % of RMS explained: 36.5 1 2 Nice TG Nice TG LPC Correlation: 0.74 % of RMS explained: 32.9 Correlation: 0.79 % of RMS explained: 38.4 MAP product AVISO product DT-(M) SLA Upd MAP-Xtrack Medsea HF • Better statistical results for the the Xtrack-HF data Detection of small coastal spatial structure: are they physically reallistic ? Are they Linked with the LPC dynamics ?
Far from the LPC: • Dephasing between the two signals: • the Offshore and the coastal don’t « see » the same dynamics (eddy ?) . The altimetric and TG signals have equivalent amplitude: The steric effect is a large wavelenght signal 2 January LPC current Time Eddy ? Meander ? August August January Close to the LPC and to the coast: The two signals are well phased: The altimetric signal has a lower amplitude: Intrinsic seasonal variability of the LPC is shifted toward the steric signal. 1 2 1 Hovmuller plots of across track geostrophic velocity anomalies (TP track-222 in 2001) cm/s Time latitude offshore Coast Aviso product MAP product
Comparisons of the Map-Xtrack data with a regional standard product Example at the Sete Tide Gauge
Comparisons at the Sète TG: Number of available dataMAP-Xtrack Medsea HF vs DT-(M) Upd 95 120 95 120 MAP product Aviso product MAP-Xtrack Medsea HF DT-(M) SLA Upd MAP-Xtrack medsea HF processing allows to recover more data far and close to the coast
Comparisons at the Sète TG: % of RMS explained: MAP-Xtrack Medsea HF vs DT-(M) SLA Upd Sète TG Correlation: 0.84 % of rms explained: 45.6 Correlation: 0.77 % of rms explained: 35.9 Correlation: 0.89 % of rms explained: 52.8 Correlation: 0.79 % of rms explained: 38.9 Sète TG % % 10 40 10 40 MAP product Aviso product MAP-Xtrack Medsea HF DT-(M) SLA Upd Better statistical results for the the Xtrack-HF data Stronger improvement than at Nice TG
Comparisons of the Map-Xtrack data with a regional standard product Mean statistics at Tide gauges over the whole area Tide Gauges
Multi-satellite: Mean Statistics at TGs Topex / Poseidon MAP Number of data Distance to TGs (km) Correlation RMS difference (cm) % of RMS explained Jason 1 GFO
Multi-satellite crossover geostrophic velocities Sea level anomalies comparisons in the Bay of Biscay along Jason-1 ground track 137 (July-August 2004). CAL/VAL at the Senetosa Tide Gauge Sea level anomalies comparisons in the Mediterranean Sea along Multi-satellite ground track (2001-2003). See also poster Bouffard et al, «A view from multi-mission satelite altimetry over the coastal ocean: a study in the Ligurian Sea and the Corsica channel. » (OSTST 2007) Ligurian Sea Correlation SYMPHONIE model elevations – altimetry SLA: TOPEX + GFO 2001 Corsica Channel Correlation SYMPHONIE model elevations – altimetry SLA: Jason + GFO Jason-1 pass 222 Crossover points Crossover Envisat 258 Jason44 In-situ station 2002 M3 tide gauge (Senetosa) Mean=0.1046m Std dev=0,0252m 0.7 0.9 Correlation SYMPHONIE model elevations – altimetry SLA: Jason + GFO + Envisat Blue: altimeter data Red: Symphonie coastal model 2003 SSH absolute bias at M3 tide gauge, Jason-1 pass 085 Crossover Envisat 588 Envisat 257 Crossover Envisat 588 GFO 257 Crossover Envisat 257 Jason85 See also Roblou et al, « x-track a new processing tool for altimetry in coastal oceans » See also Bouffard et al, « Improved Altimetry in the Northwestern Mediterranean : Comparison of Ocean Dynamics with a Regional Circulation Model » Jason-1 pass 085 • Good agreements on instantaneous sea levels • Satisfying correlation for synoptic scales and meso-scales dynamics • Altimeter data exhibit short scales processes not represented in the model simulations Ellipses of geostrophic velocity anomalies at altimetric crossovers Comparisons with the normalized transport (from in-situ data) Crossover Jason 44 Jason 85 Crossover Envisat 588 Jason 44 Crossover GFO 257 Jason 85 Meridional dirrection Conclusion • Processings • Specific editings allow to eliminate spurious data and improve the quality of coastal altimetric products • Regional de-aliasing models strongly improves altimetric data • High frequency along track sampling allow to highlight small spatial dynamical processes • Comparisons with a standard product • More coastal data with the MAP processings • Closer to the coastline • Better quality of the altimetric data • Applications • Validation of Regional 3D models • Cal/Val • Monitoring of transport in marginal areas